Monitoring and logging
Introduction
Cinchy's monitoring and logging capabilities are an important part of ensuring that your platform runs optimally. Logs can be used to trace various activities in the system and can provide context on errors that may arise such as failed queries or stack exceptions.
IIS logs
Cinchy platforms running on IIS deployment can access the system logs via the Admin Panel.
You can view the admin panel of your Cinchy instance by using the /admin/index endpoint. This is only reachable if you are logged in as a user with admin access.
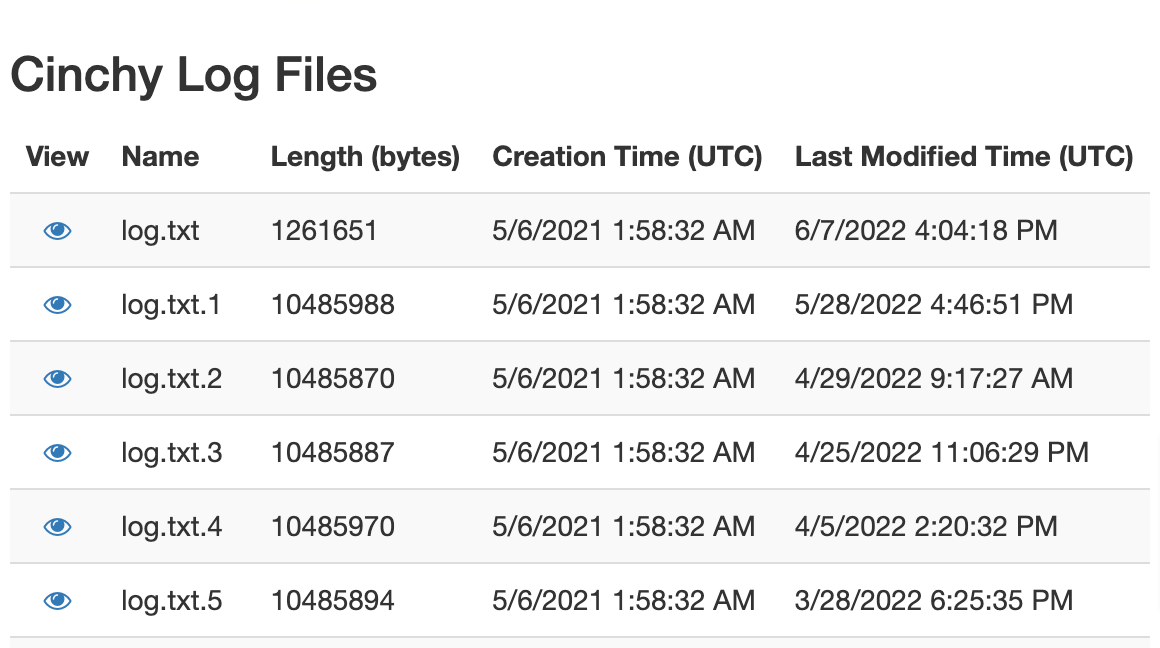
The Log Files section of the admin panel contains the following information:
| Name | Description |
|---|---|
| View (eye icon) | Clicking the view icon will download the associated log. |
| Name | The name of the log file. |
| Length (bytes) | The size of the long file in bytes. |
| Created Time (UTC) | The date and time stamp of when the log was created, in Coordinated Universal Time. |
| Last Modified Time (UTC) | The date and time stamp of when the log was last modified, in Coordinated Universal Time. |
Kubernetes logs
Cinchy v5 on Kubernetes offers and recommends a robust set of open-source tools and applications for monitoring, logging, and visualizing the data on your Cinchy instances.
The following tools are available with the recommended Cinchy deployment on Kubernetes. Click on the respective link below to learn more about it:
Connections logs
Running data syncs in Cinchy will provide separate execution and error logs unique to your connection.
Further details on this type of logging can be found here.