Grafana
Grafana overview
Grafana is an open source analytics and interactive visualization web application. When connected to your Cinchy platform, it provides charts, graphs, and alerting capabilities (Image 1).
Grafana, and its paired application Prometheus (which consumes metrics from the running components in your environment) is the recommended visualization application for Cinchy v5 on Kubernetes.

Get started with Grafana
Grafana has a robust library of documentation of tutorials designed to help you learn the fundamentals of the application. We've listed some notable ones below:
When using the default configuration pairing of Grafana and Prometheus, Prometheus is already set up as a data source in your metrics dashboard.
- Exploring your Metrics
- Best Practices for Creating Dashboards
- Building a Dashboard
- Guide to Dashboard Types and Capabilities
- Creating a Managed Alert
- All Documentation
Access your saved dashboards
Cinchy comes with some saved dashboards that come out of the box. These dashboards will provide a great jumping off point for your metrics monitoring, and you can always customize, manage, and add further dashboards at your leisure.
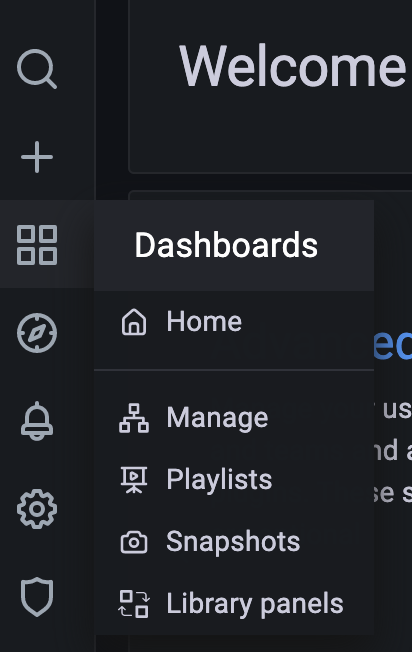
- Navigate to the left navigation pane, select the Dashboards icon > Manage (Image 2).
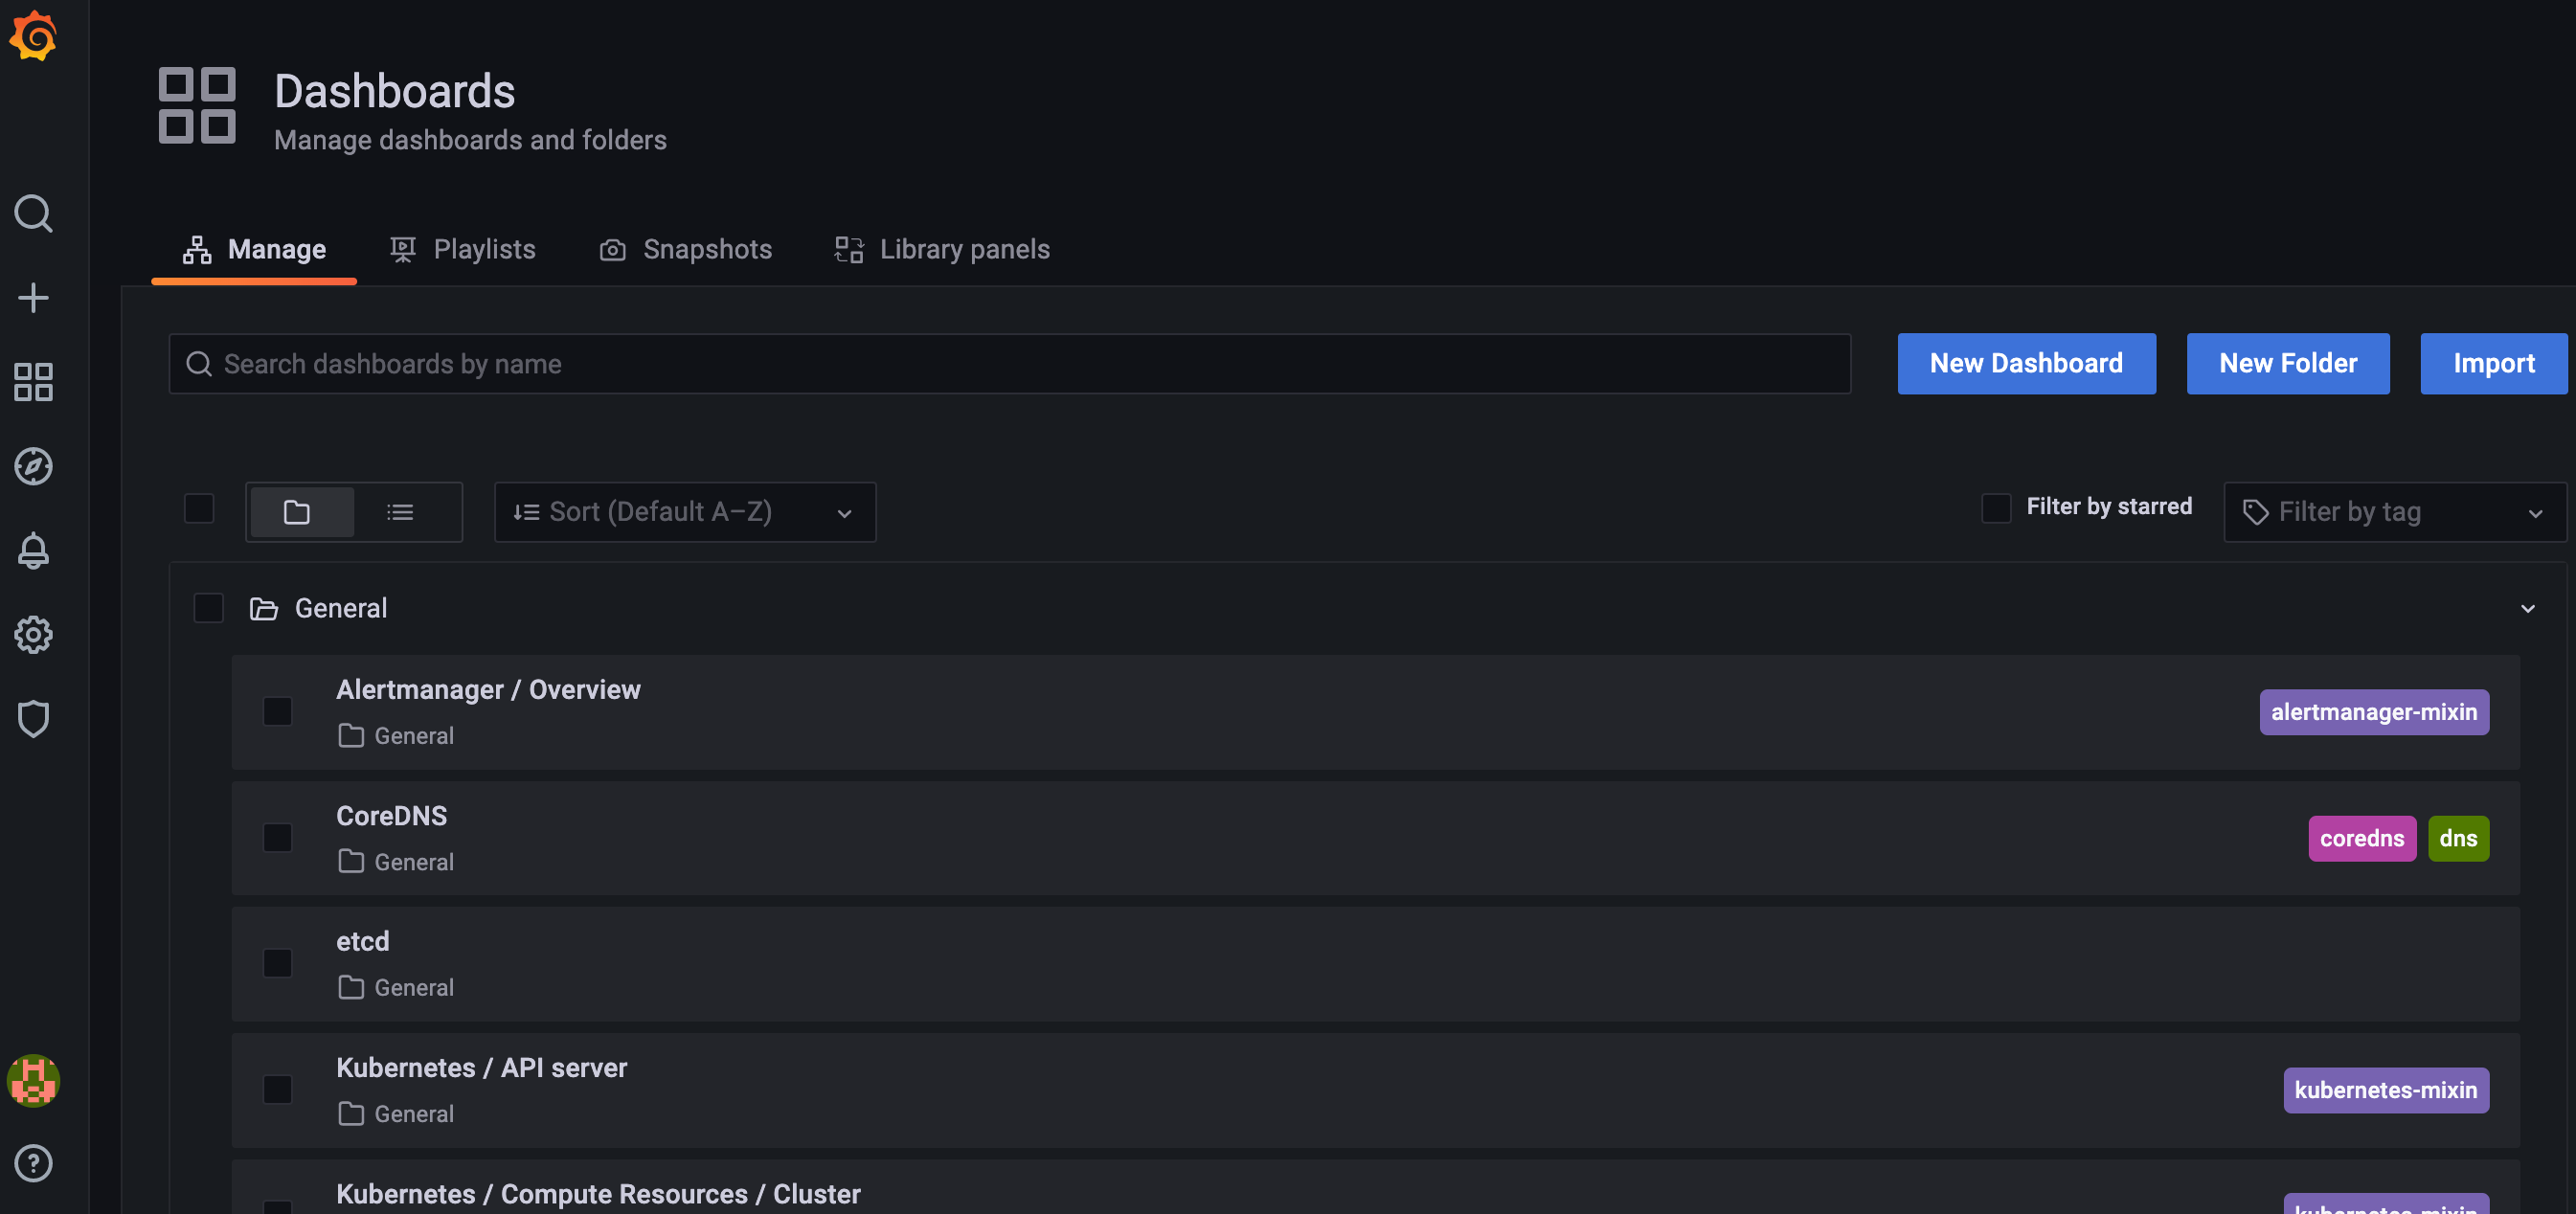
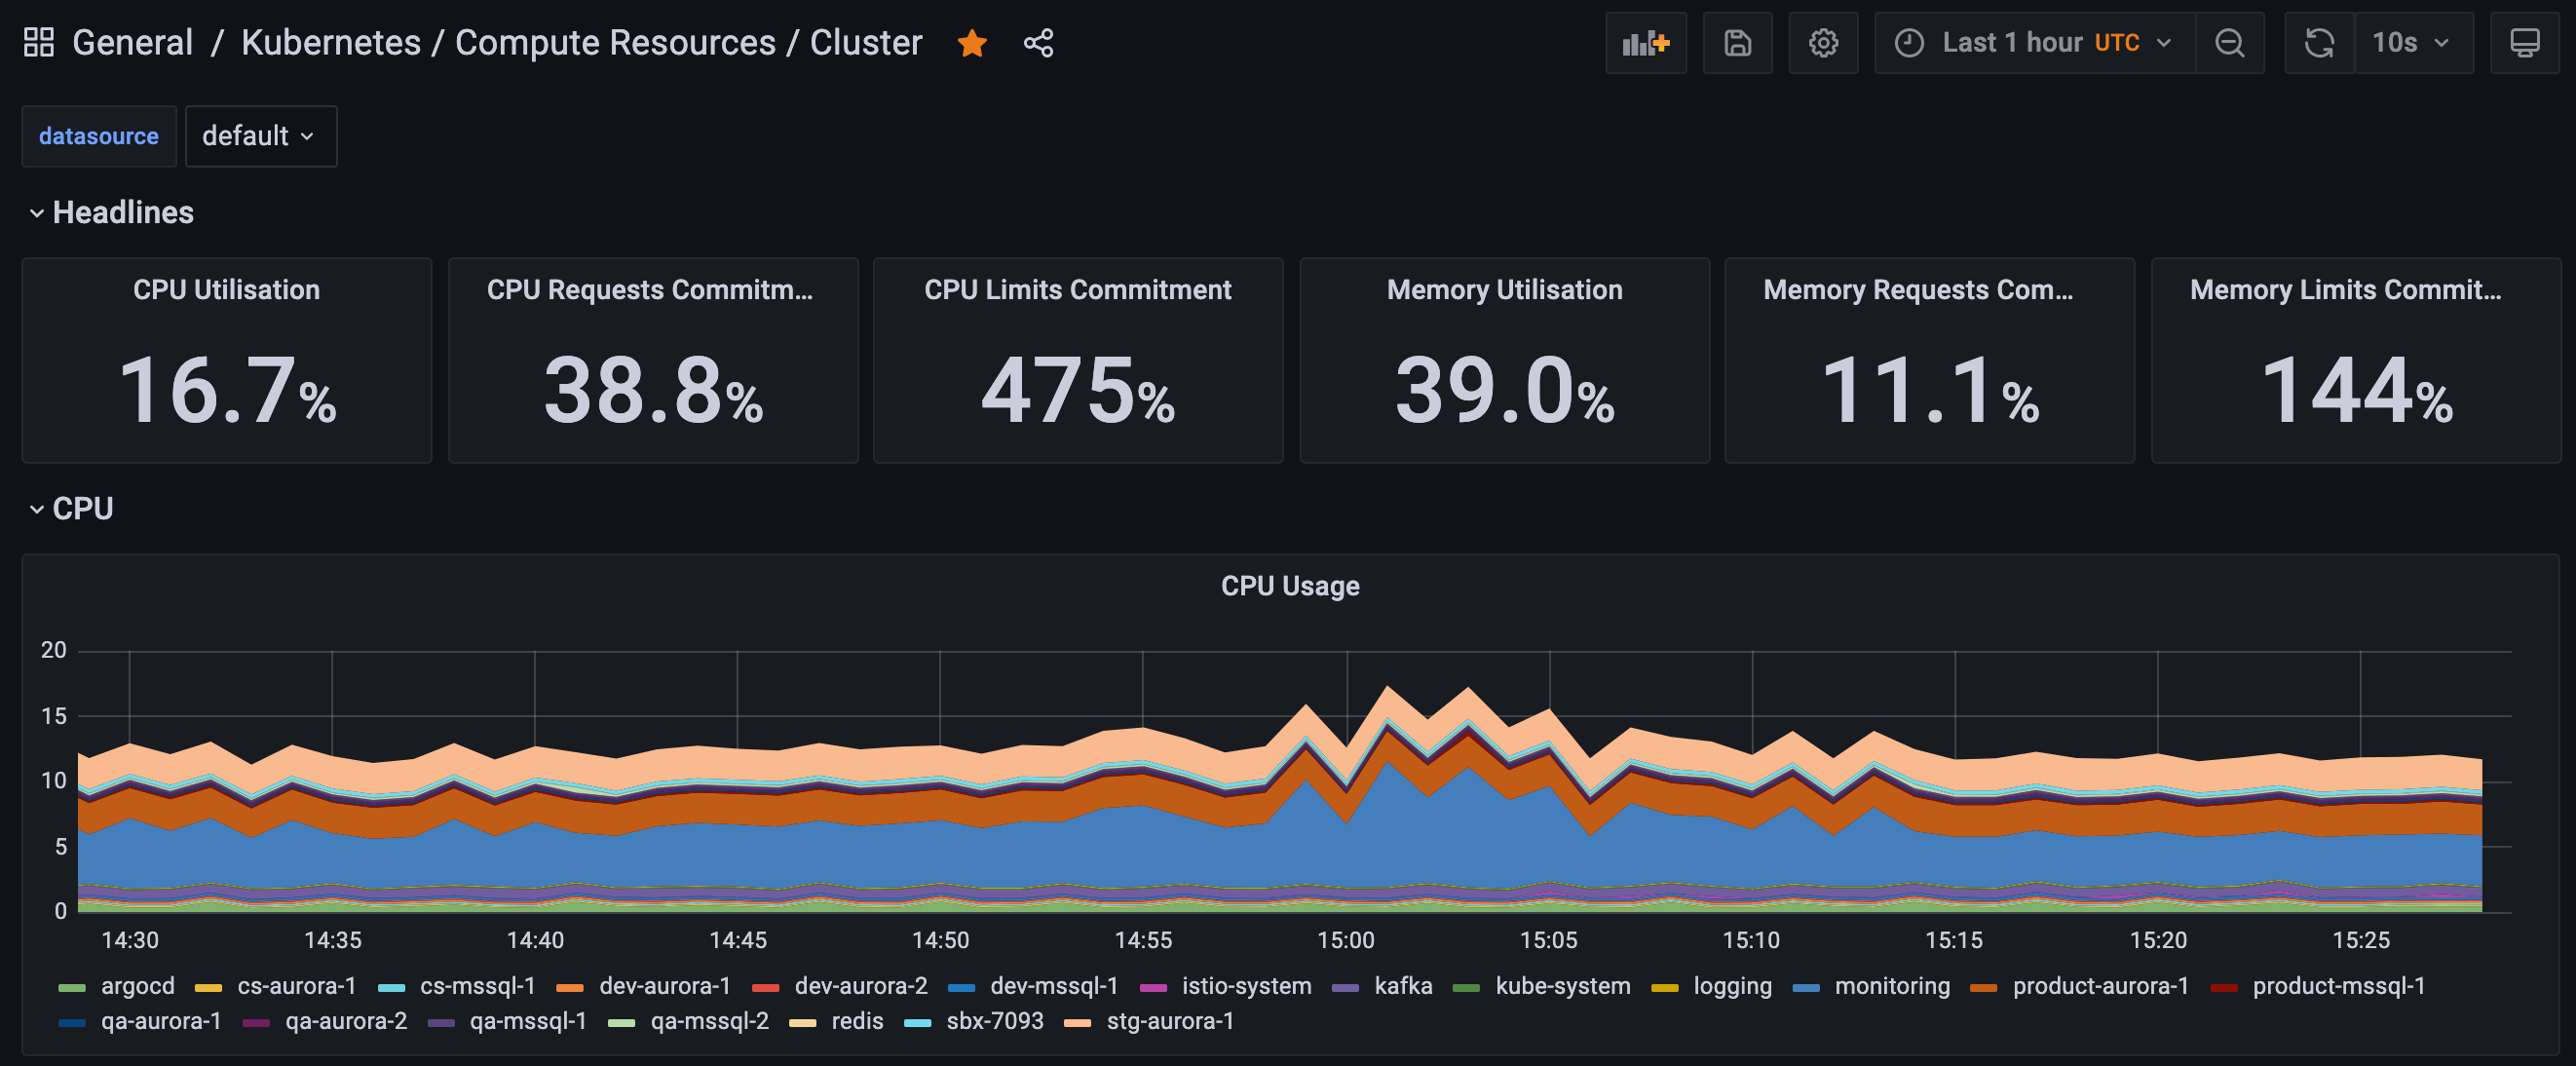
2. You will see a list of all of the Dashboards available to you (Image 3). Clicking on any of them will take you to a full metrics view (Image 4).
3. You can favourite any of your commonly used or most important dashboards by clicking on the star (Image 5).

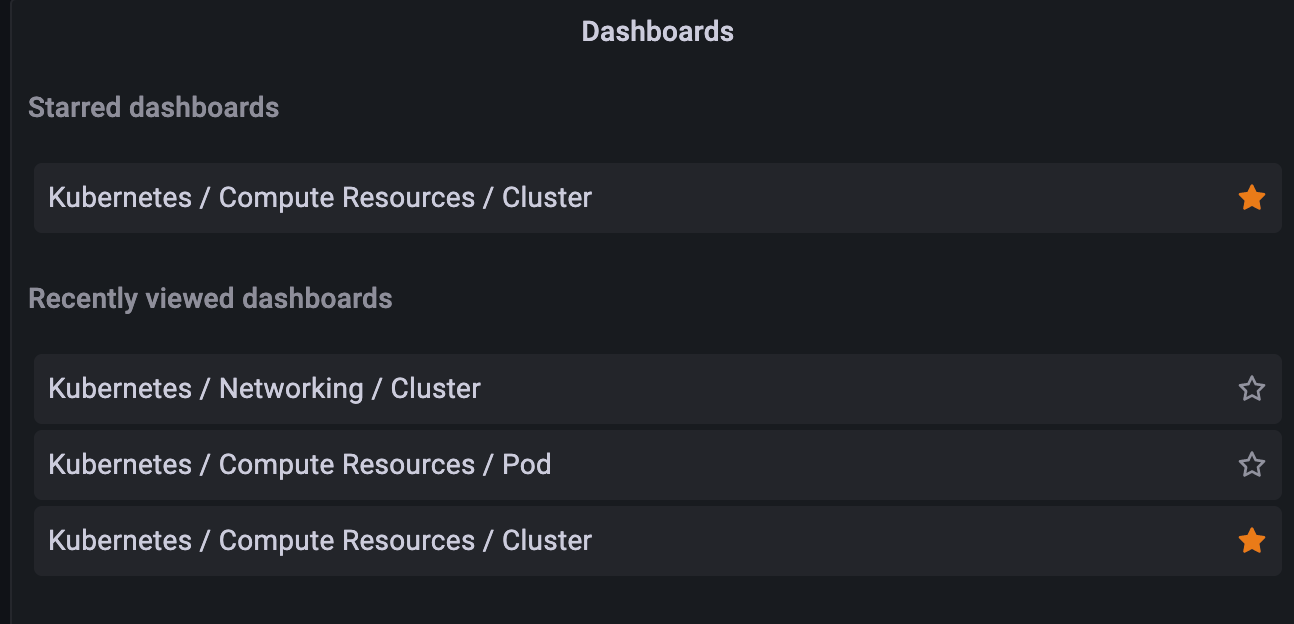
4. Once you favorite a dashboard, you can easily find it by navigating to the left navigation pane, select the Dashboards icon > Home. This will open the Dashboards Home. You can see both your favourite and your recent dashboards in this view (Image 6)
Recommended dashboards
Your Cinchy v5 deployment comes with some out-of-the-box dashboards already made. You are able to customize these to suit your specifications. The following are a few notable ones:
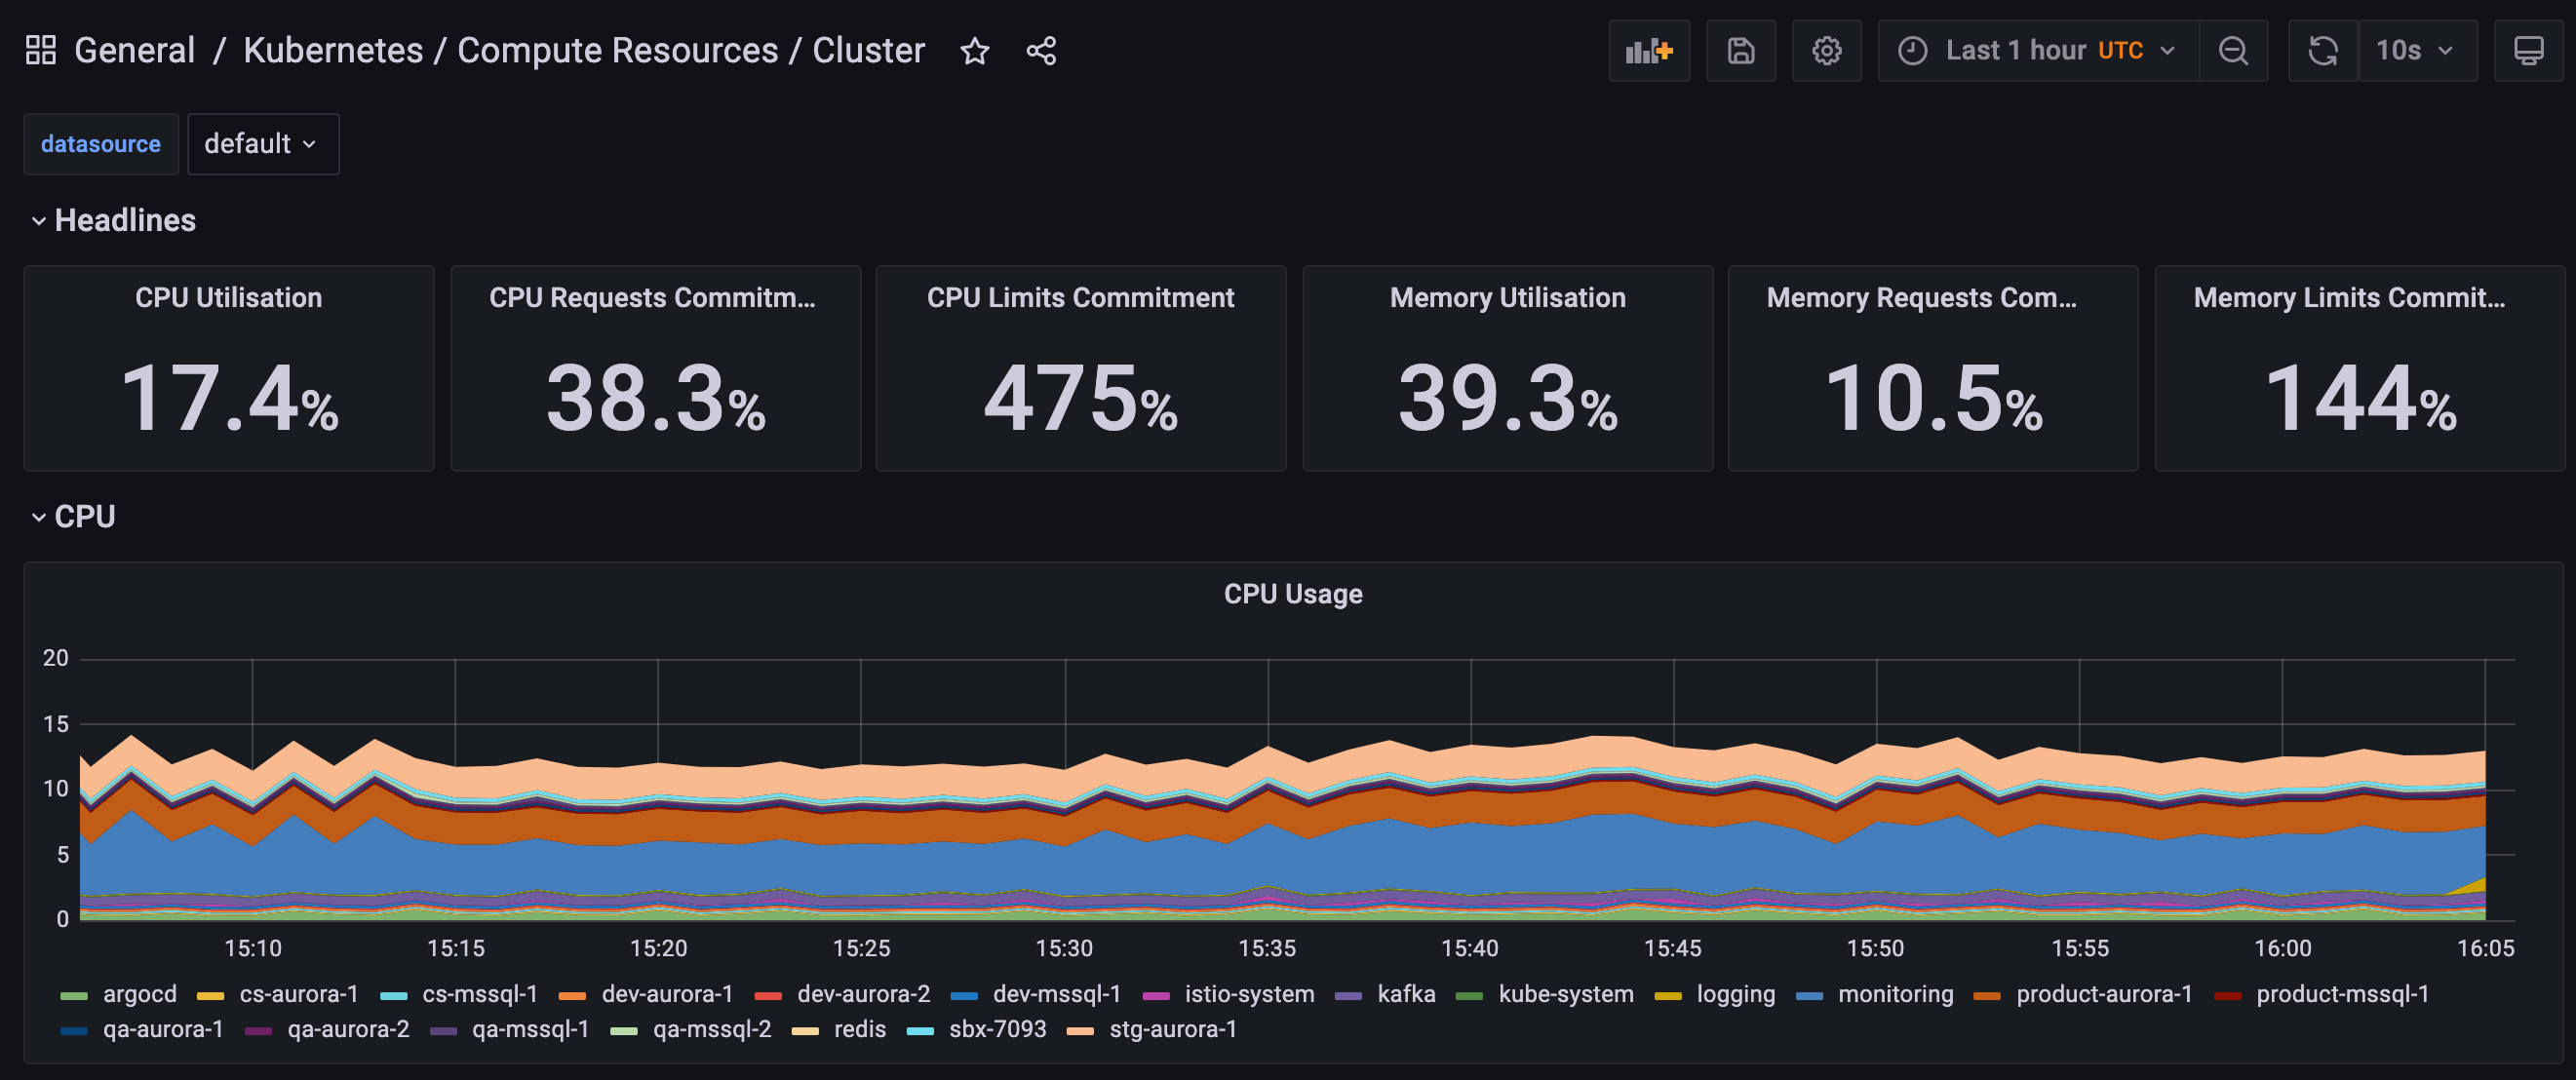
Kubernetes/Compute Resources/Cluster
Purpose: This dashboard provides a general overview of your entire cluster including all of your environments and pods (Image 7).
Metrics:
The following are some example metrics that you could expect to see from this dashboard:
- CPU Usage
- CPU OTA
- Memory Use
- Memory Requests
- Current Network Usage
- Bandwidth (Transmitted and Received)
- Average Container Bandwidth by Namespace
- Rate of Packets
- Rate of Packets Dropped
- Storage IO & Distribution
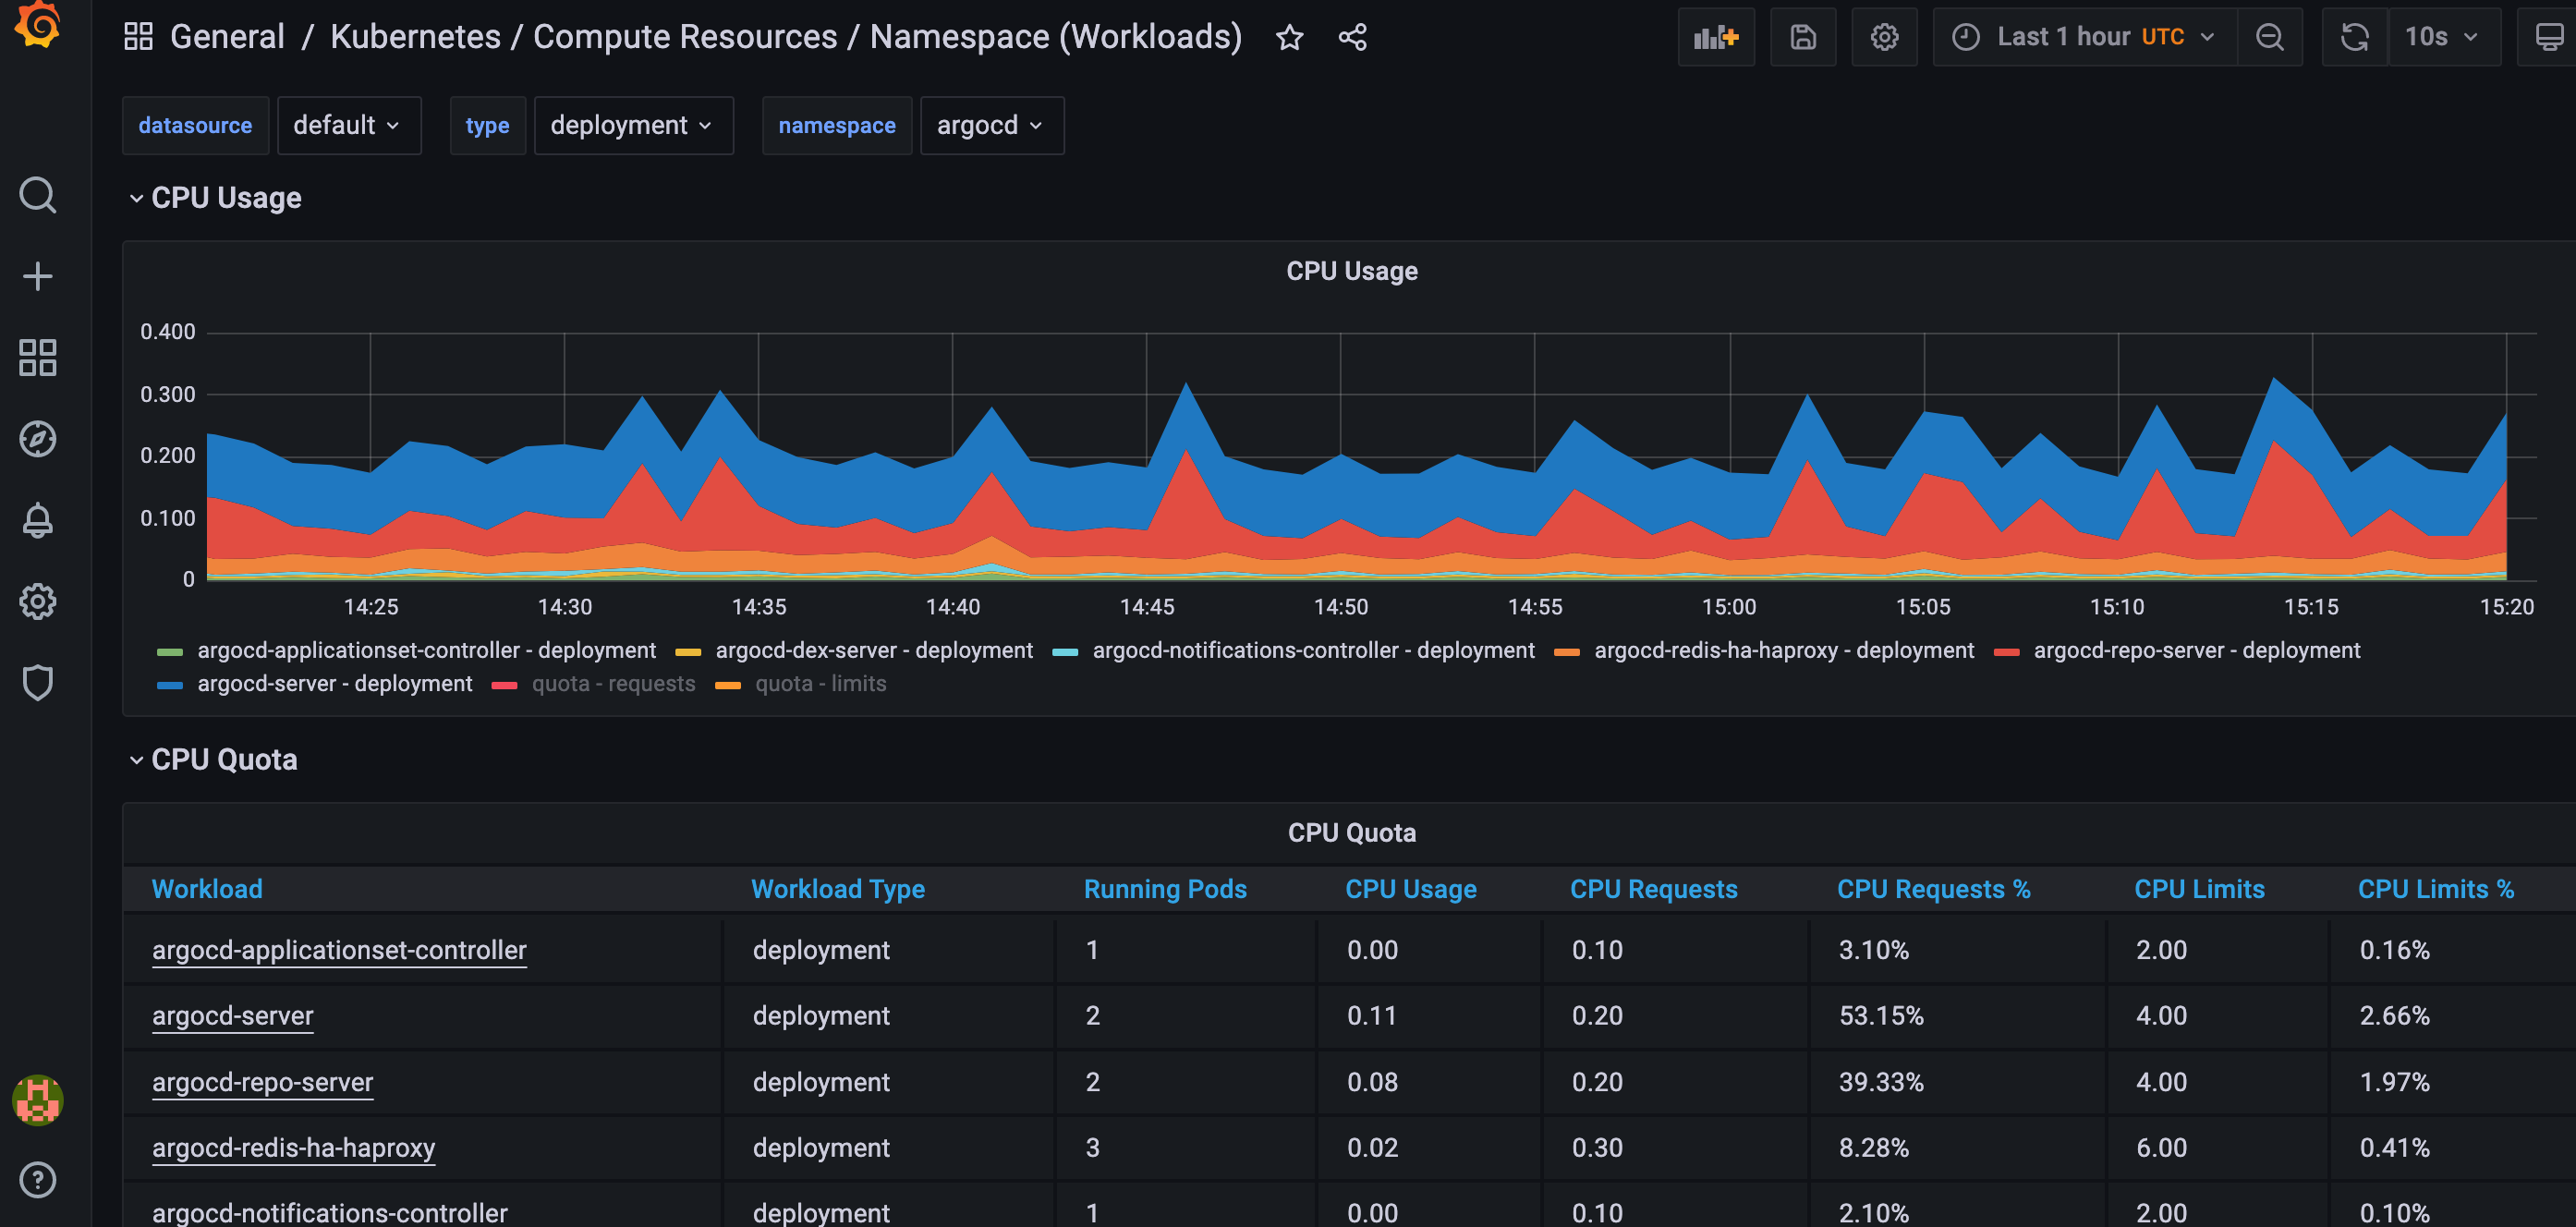
Kubernetes/Compute Resources/Namespace (Workloads)
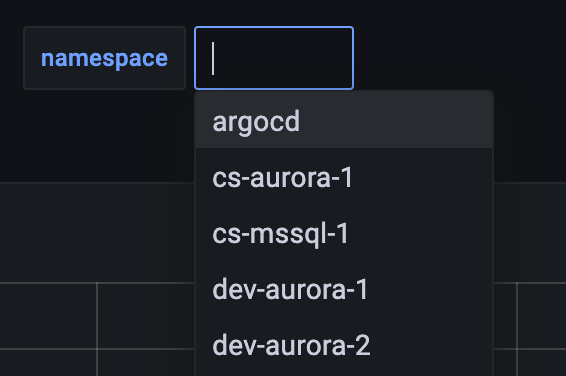
Purpose: This dashboard is useful for looking at environment specific details (Image 8). You can use the namespace drop down menu to select which environment you want to visualize (Image 9). This can be particularly helpful during load testing. You are also able to drill down to a specific workload by clicking on its name.
Metrics:
The following are some example metrics that you could expect to see from this dashboard**:**
- CPU Usage
- CPU OTA
- Memory Use
- Memory Quota
- Current Network Usage
- Bandwidth (Transmitted and Received)
- Average Container Bandwidth by Workload
- Rate of Packets
- Rate of Packets Dropped
Set up alerts
Grafana lets you to set up push alerts against your dashboards and queries. Once you have created your dashboard, you can follow the steps below to set up your alert.
Grafana doesn't have the capability to run alerts against queries with template variables.
To send emails out from Grafana, you need to configure your SMTP. This would have been done in the automation script run during your initial Cinchy v5 deployment. If you didn't input this information at that time, you must do so before setting up your email alerts.
Set up your notifications channel
Your notifications channel refers to who will be receiving your alert. To set one up:
- Click on the Alert icon on the left navigation tab (Image 10), and locate "Notifications Channel"

-
Click the "Add a Channel" button.
-
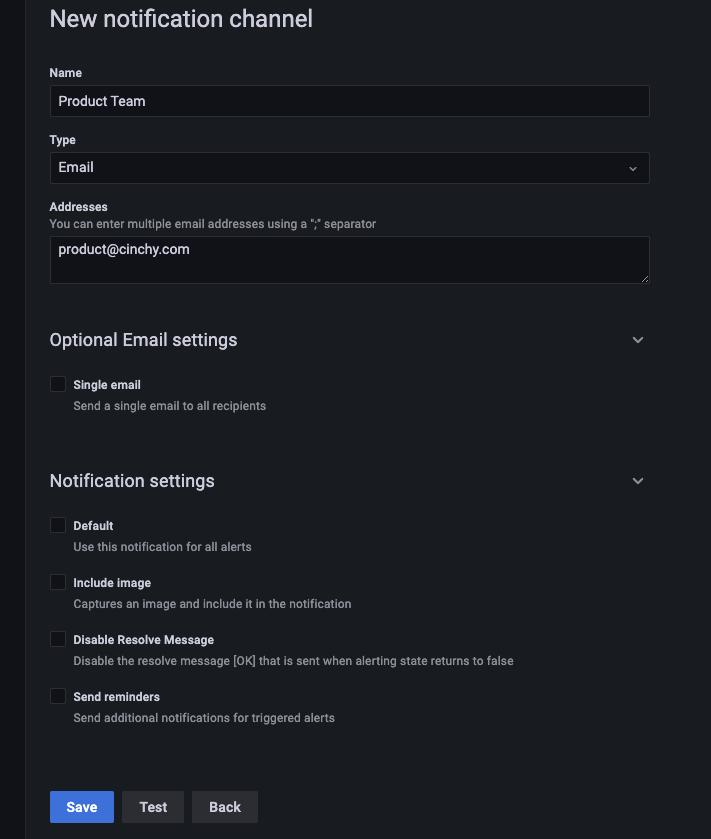
Add in the following parameters, including any optional checkboxes you wish to use (Image 11):
Name: The name of this channel.
Type: You have several options here, but email is the most common.
Addresses: Input all the email addresses you want to be notified of this alert, separated by a comma.
-
Click Test to send out a test email, if desired.
-
Save your Notification Channel.
Set up your alert
The following details how to set up alerts on your dashboards. You can also set up alerts upon creation of your dashboard from the same window.
- Navigate to the dashboard and dashboard panel that you want to set up an alert for. This example, sets up an alert for CPU usage on our cluster.
- Click on the dashboard name > Edit
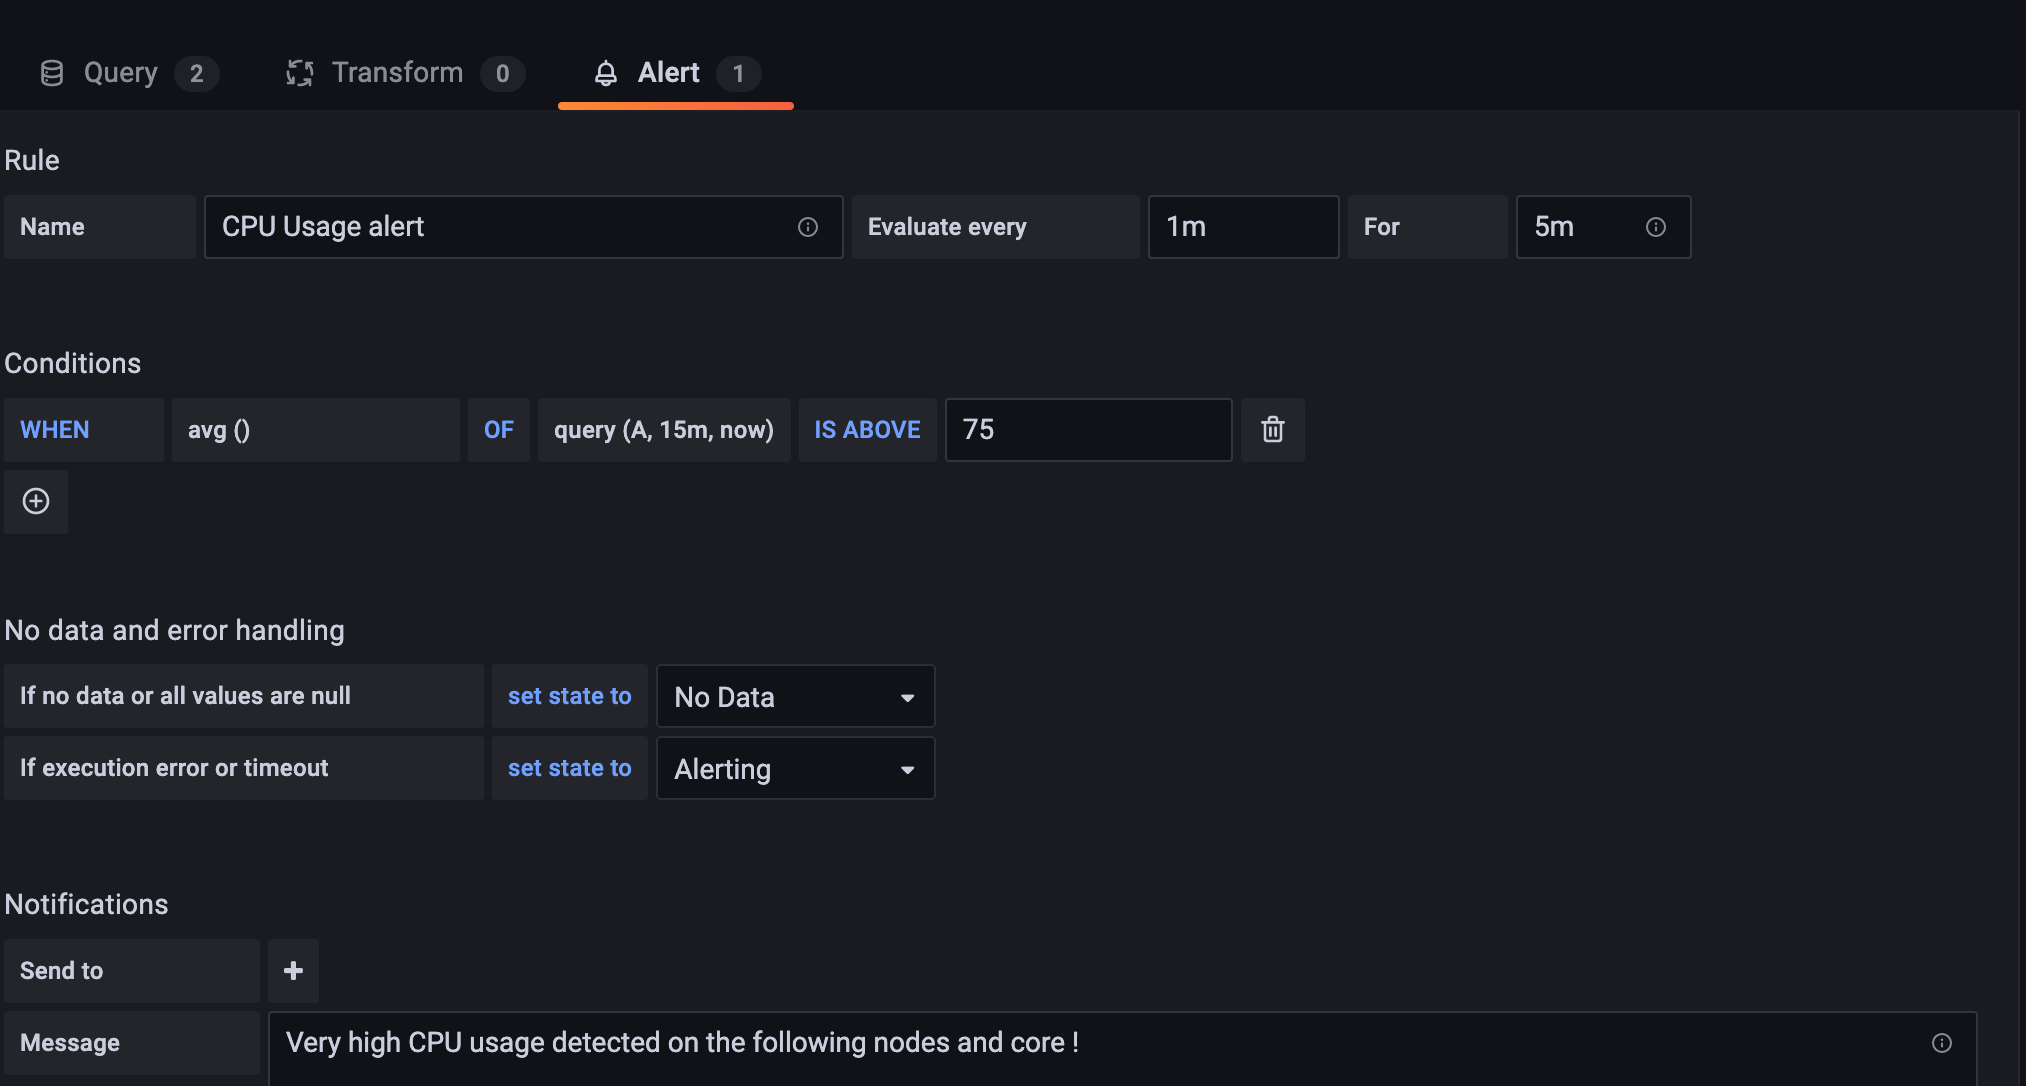
- Click on the Alert tab (Image 12).

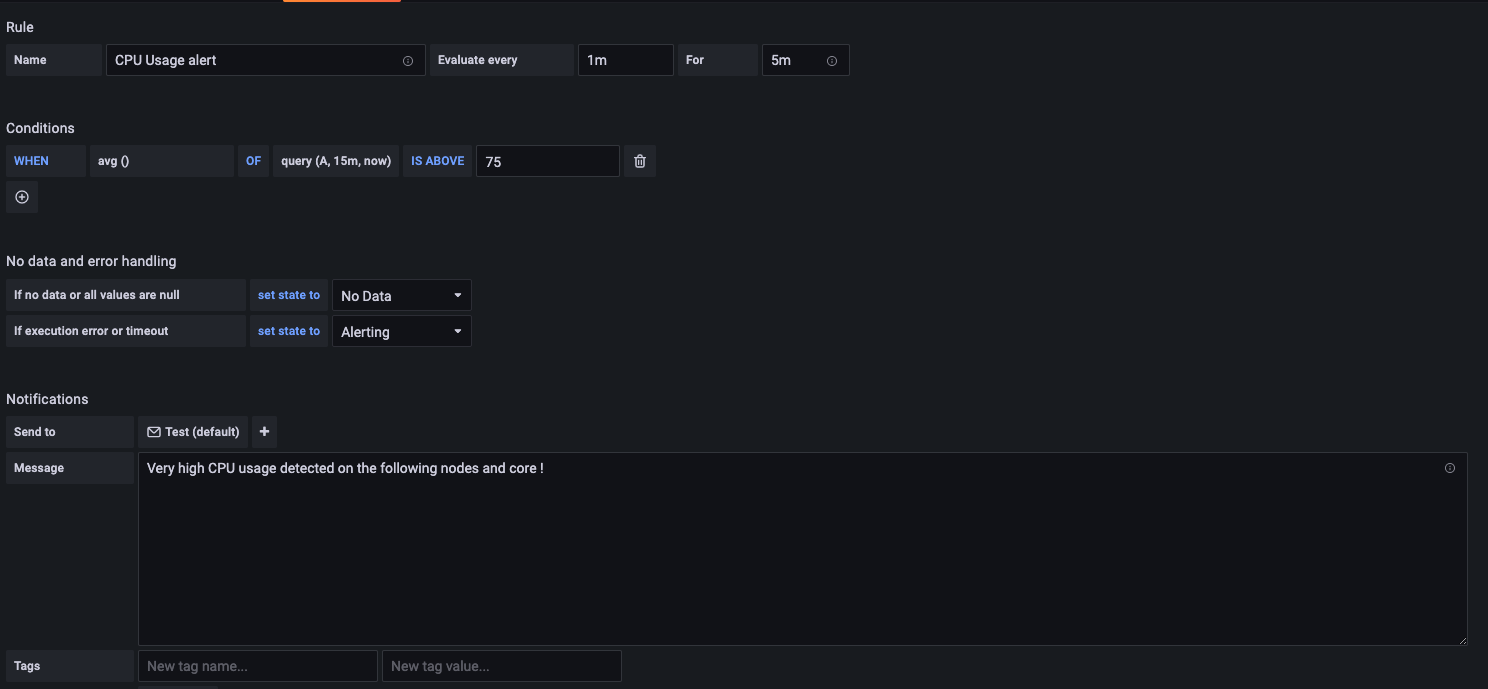
- Input the following parameters to set up your alert (Image 13):
- Alert Name: A title for your alert
- Alert Timing: Choose how often to evaluate and for how long. In this example it's evaluated every minute for five minutes.
- Conditions: Here you can set your threshold conditions for when an alert will be sent out. In this example, it's sent when the average of query A is above 75.
- Set what happens if there's no data, or an error in your data
- Add in your notification channel (who will be sent this notification)
- Add a message to accompany the alert.
- Click Apply > Save to finalize your alert.
Click on an image to enlarge it.
Recommended alerts
Below are a few alerts we recommend setting up on your Grafana.
CPU usage
Set up this alert to notify you when the CPU Usage on your nodes exceeds a specified limit.
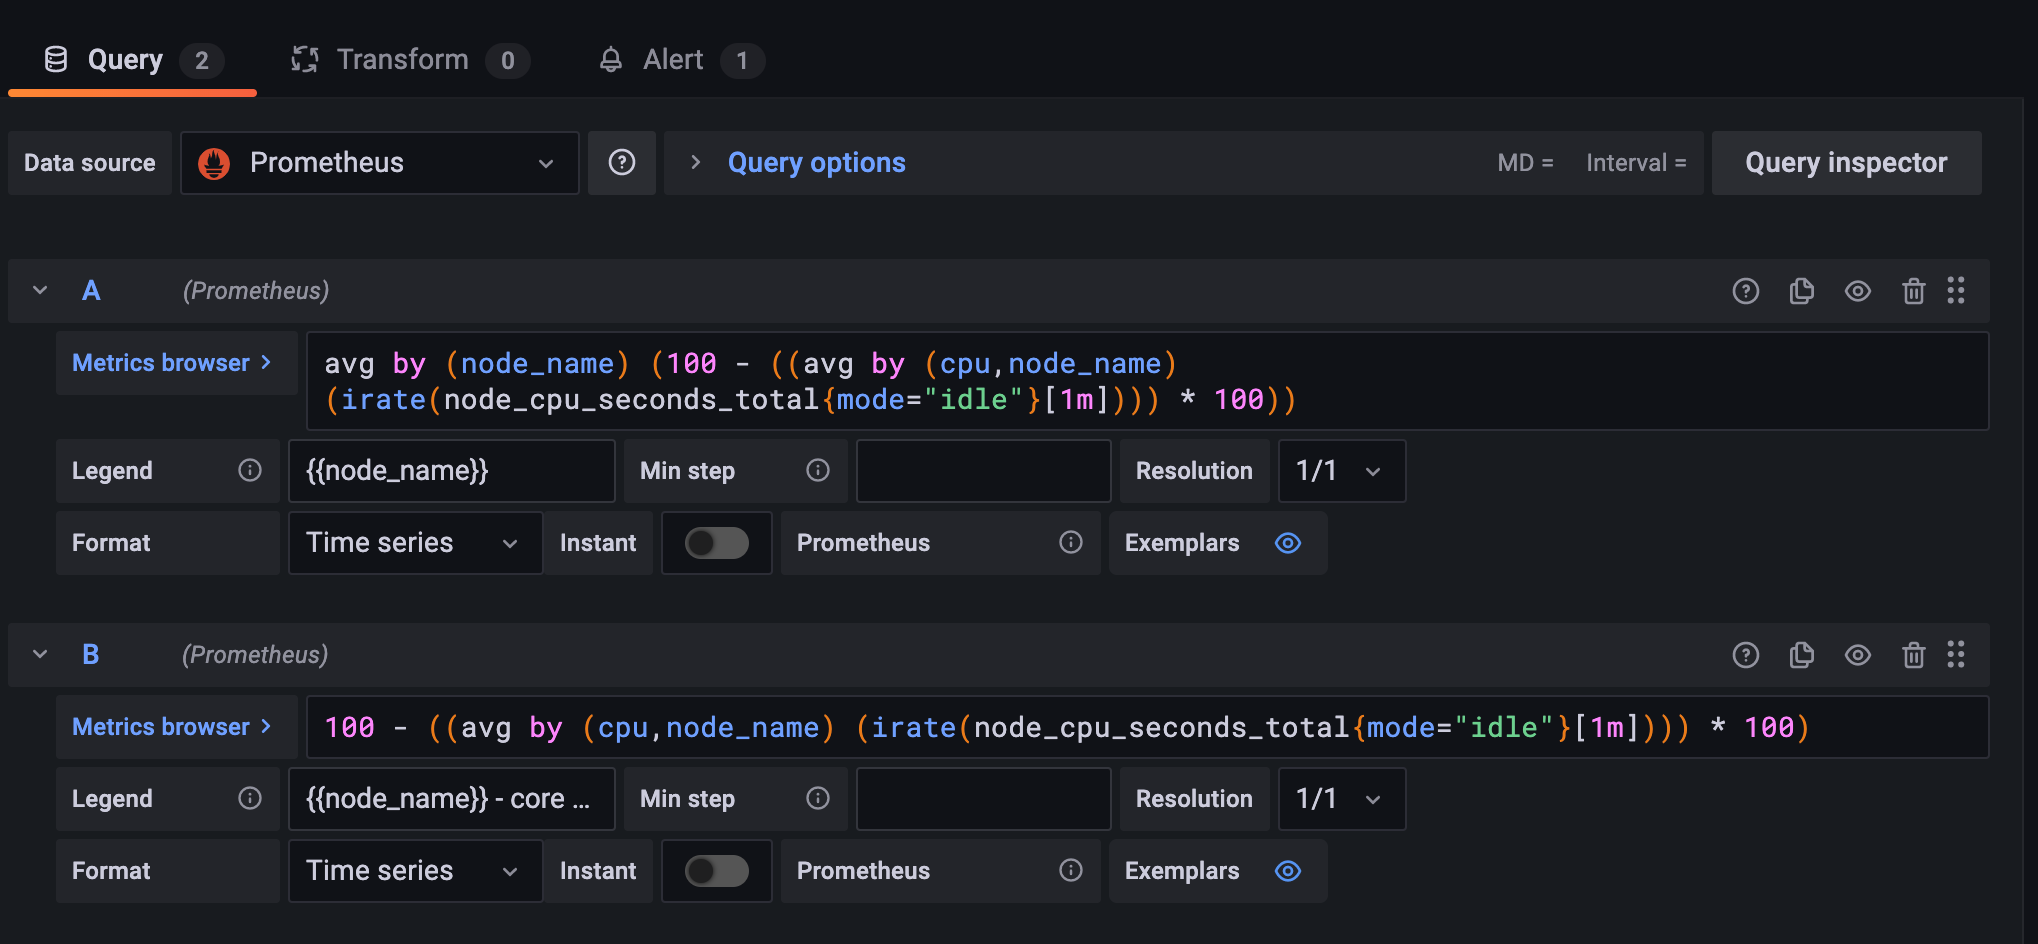
Dashboard query
You can use the following example queries to set up a dashboard that will capture CPU Usage by Node (Image 14).
avg by (node_name) (100 - ((avg by (cpu,node_name) (irate(node_cpu_seconds_total{mode="idle"}[1m]))) * 100))
100 - ((avg by (cpu,node_name) (irate(node_cpu_seconds_total{mode="idle"}[1m]))) * 100)
Alert:
Set up your alert. This example uses a threshold limit of 75 (Image 15).
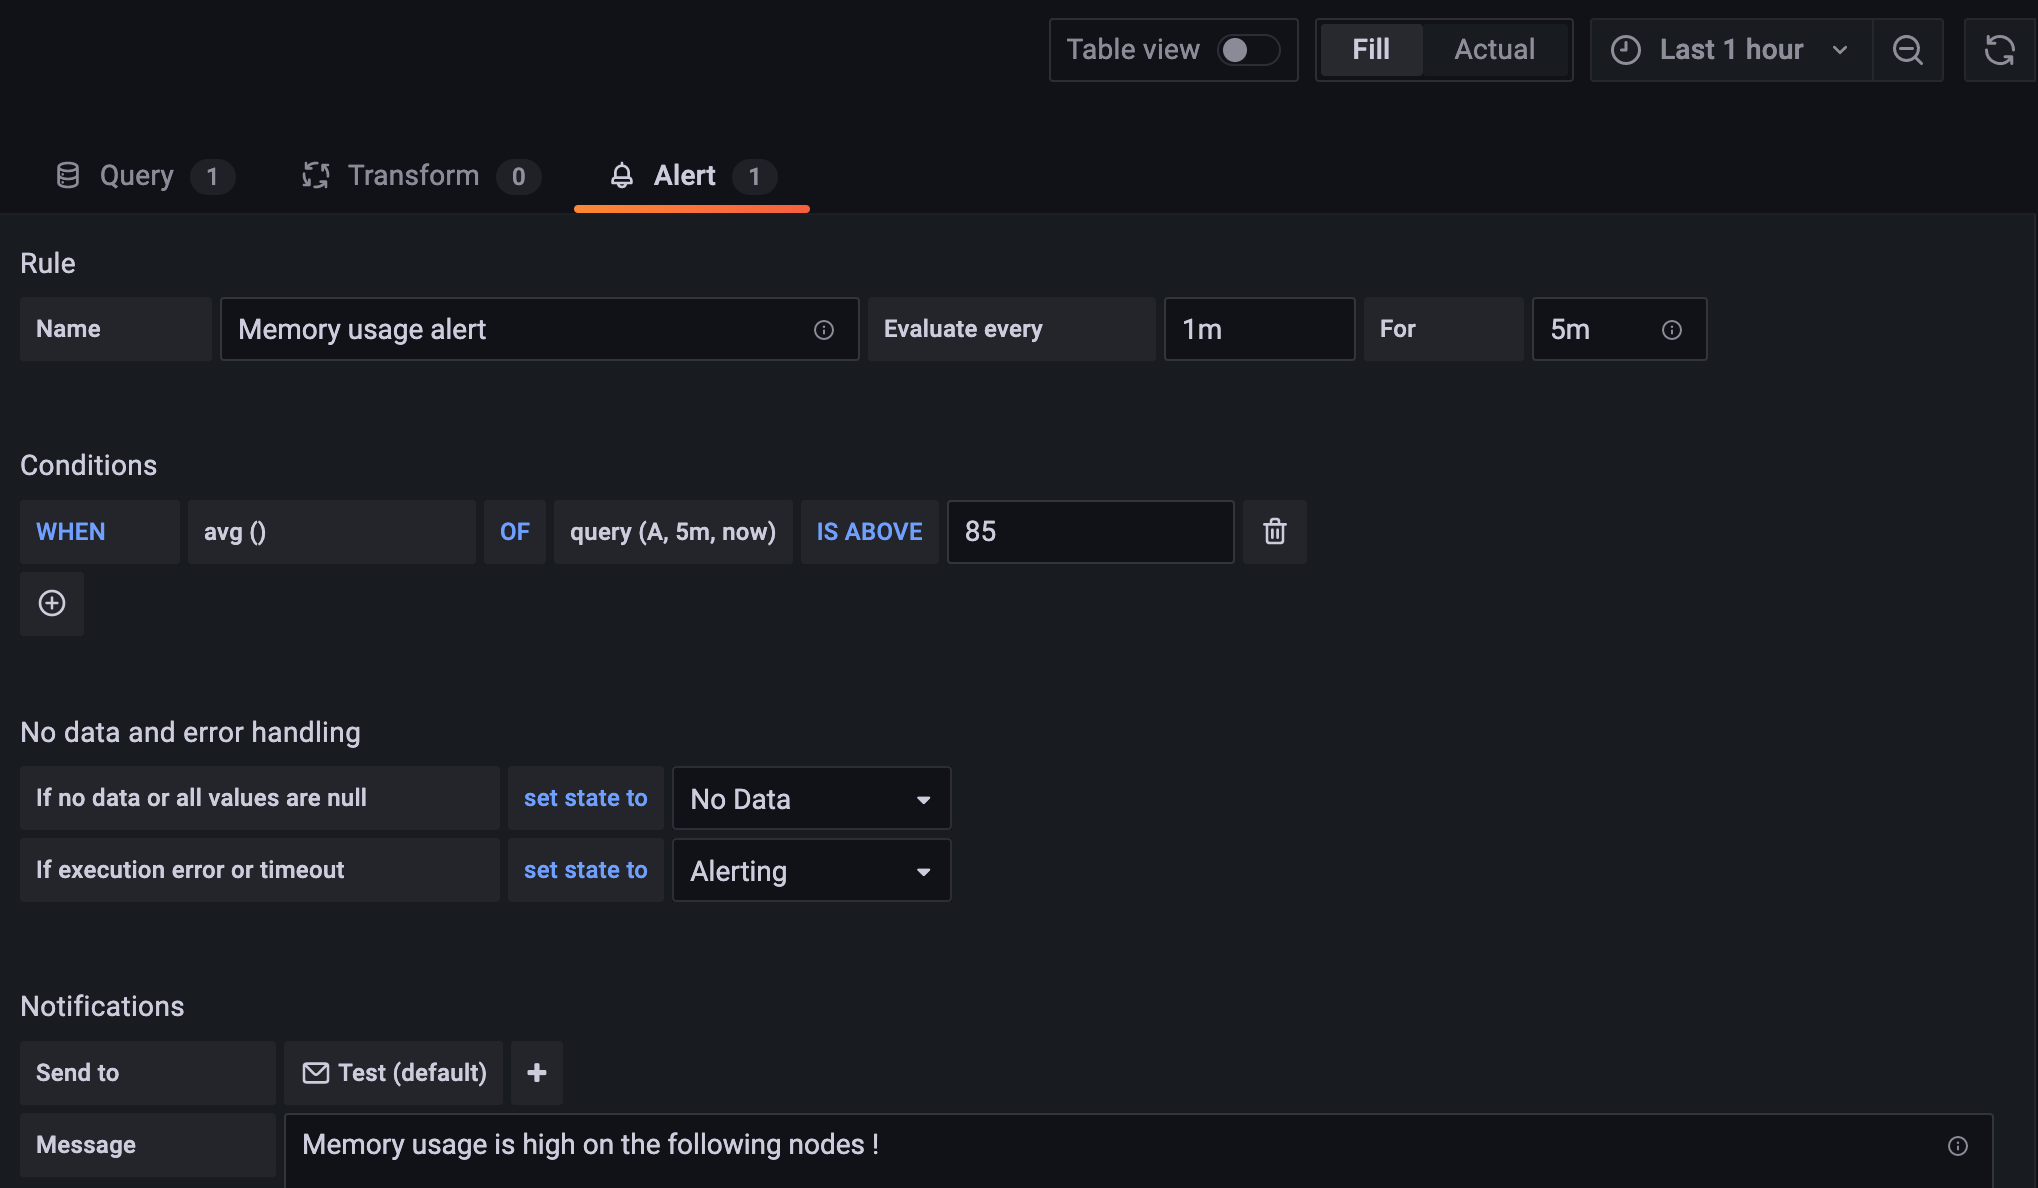
Memory usage
Set up this alert to notify you when the Memory Usage on your nodes exceeds a specified limit.
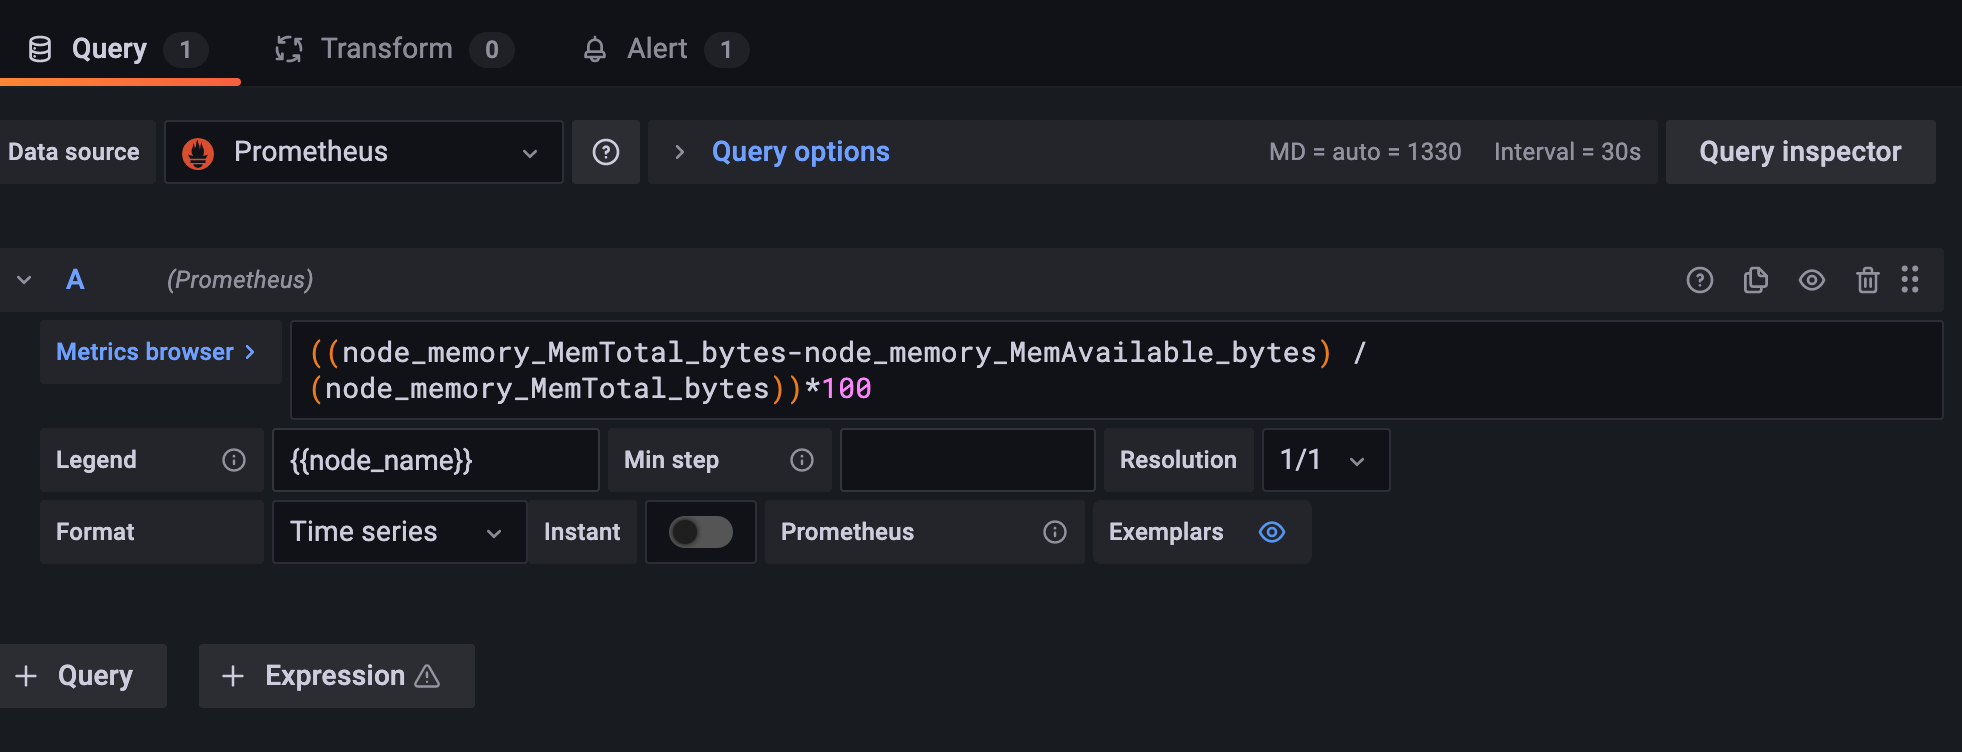
Dashboard query
You can use the following example queries to set up a dashboard that will capture CPU Usage by Node (Image 16)
((node_memory_MemTotal_bytes-node_memory_MemAvailable_bytes) / (node_memory_MemTotal_bytes))*100
Alert:
Set up your alert. This example uses a threshold limit of 85 (Image 17).
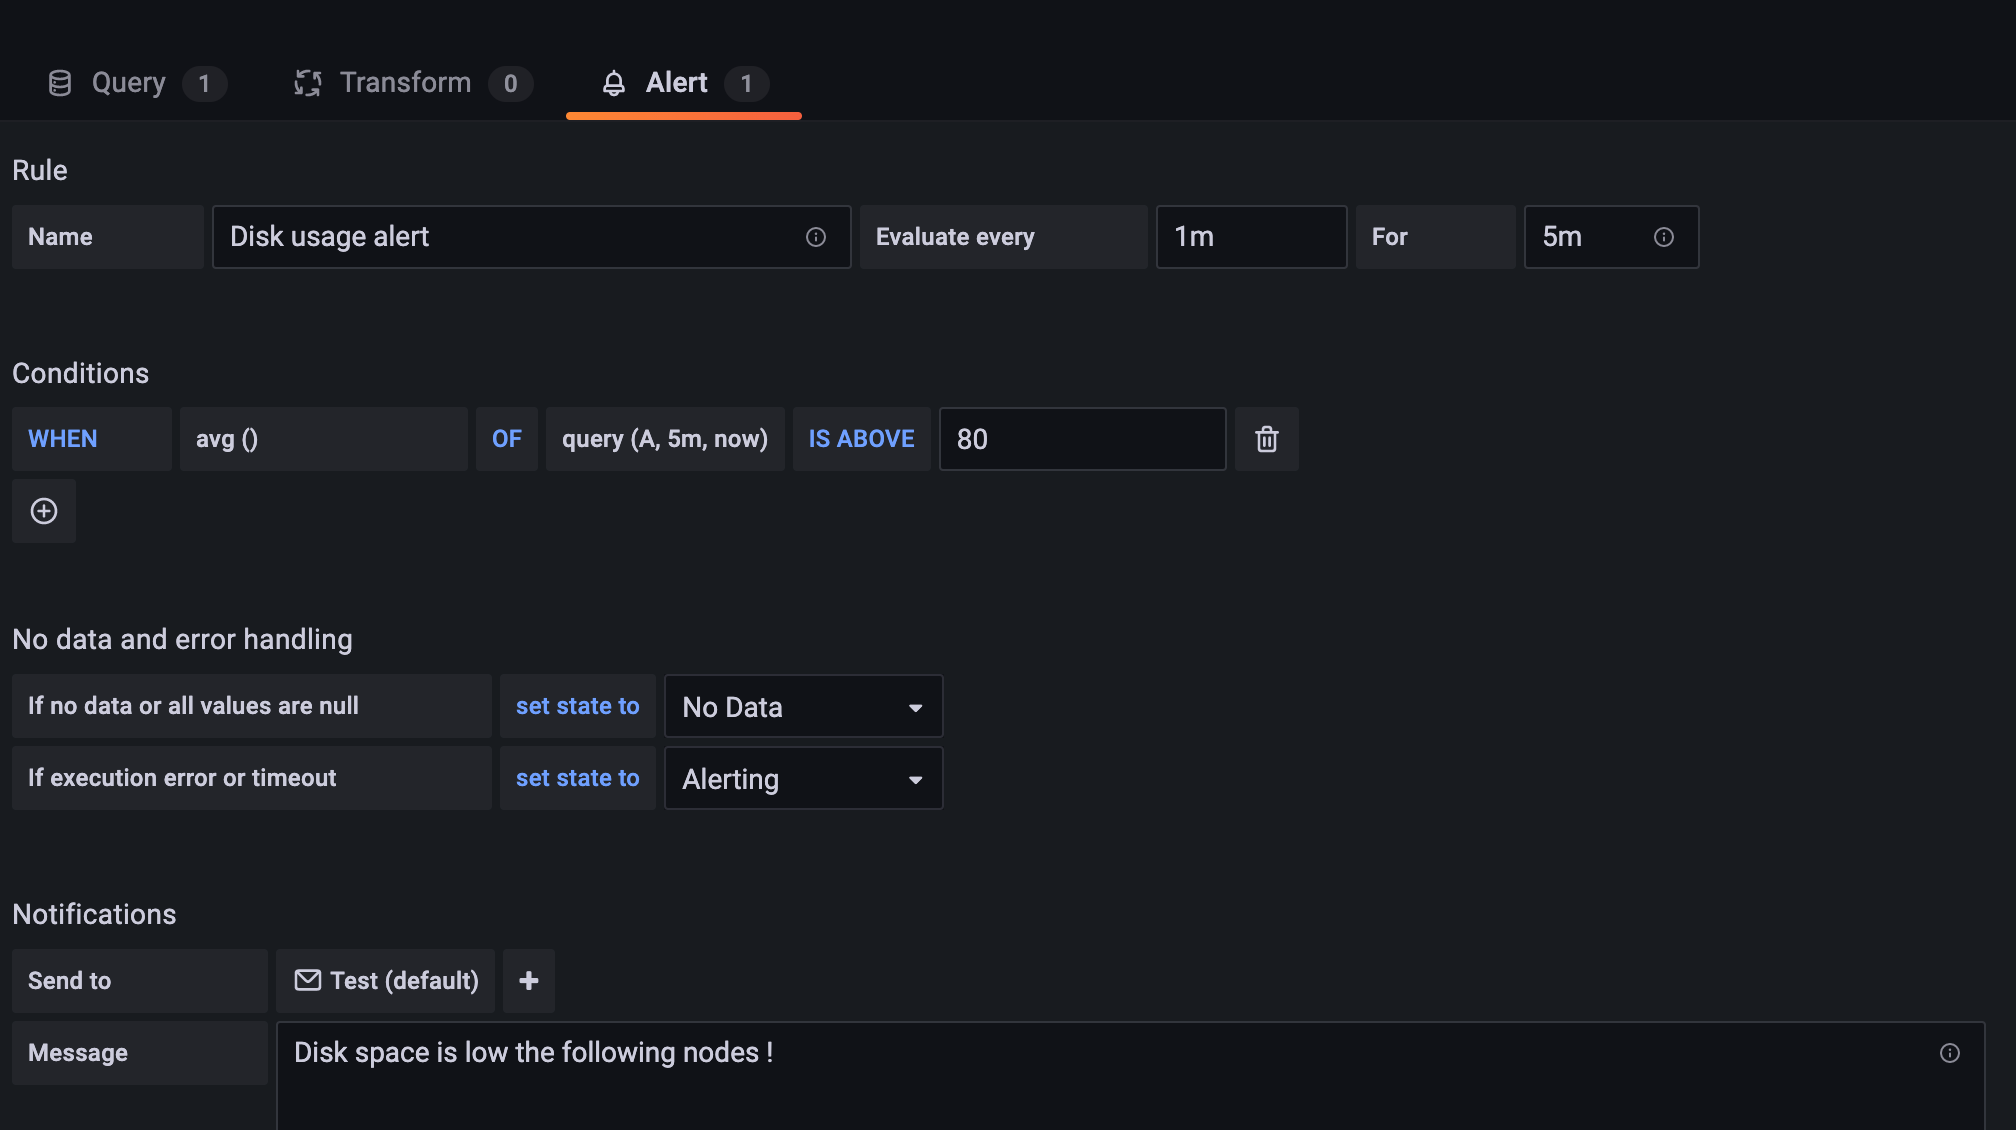
Disk usage
Set up this alert to notify you when the Disk Usage on your nodes exceeds a specified limit.
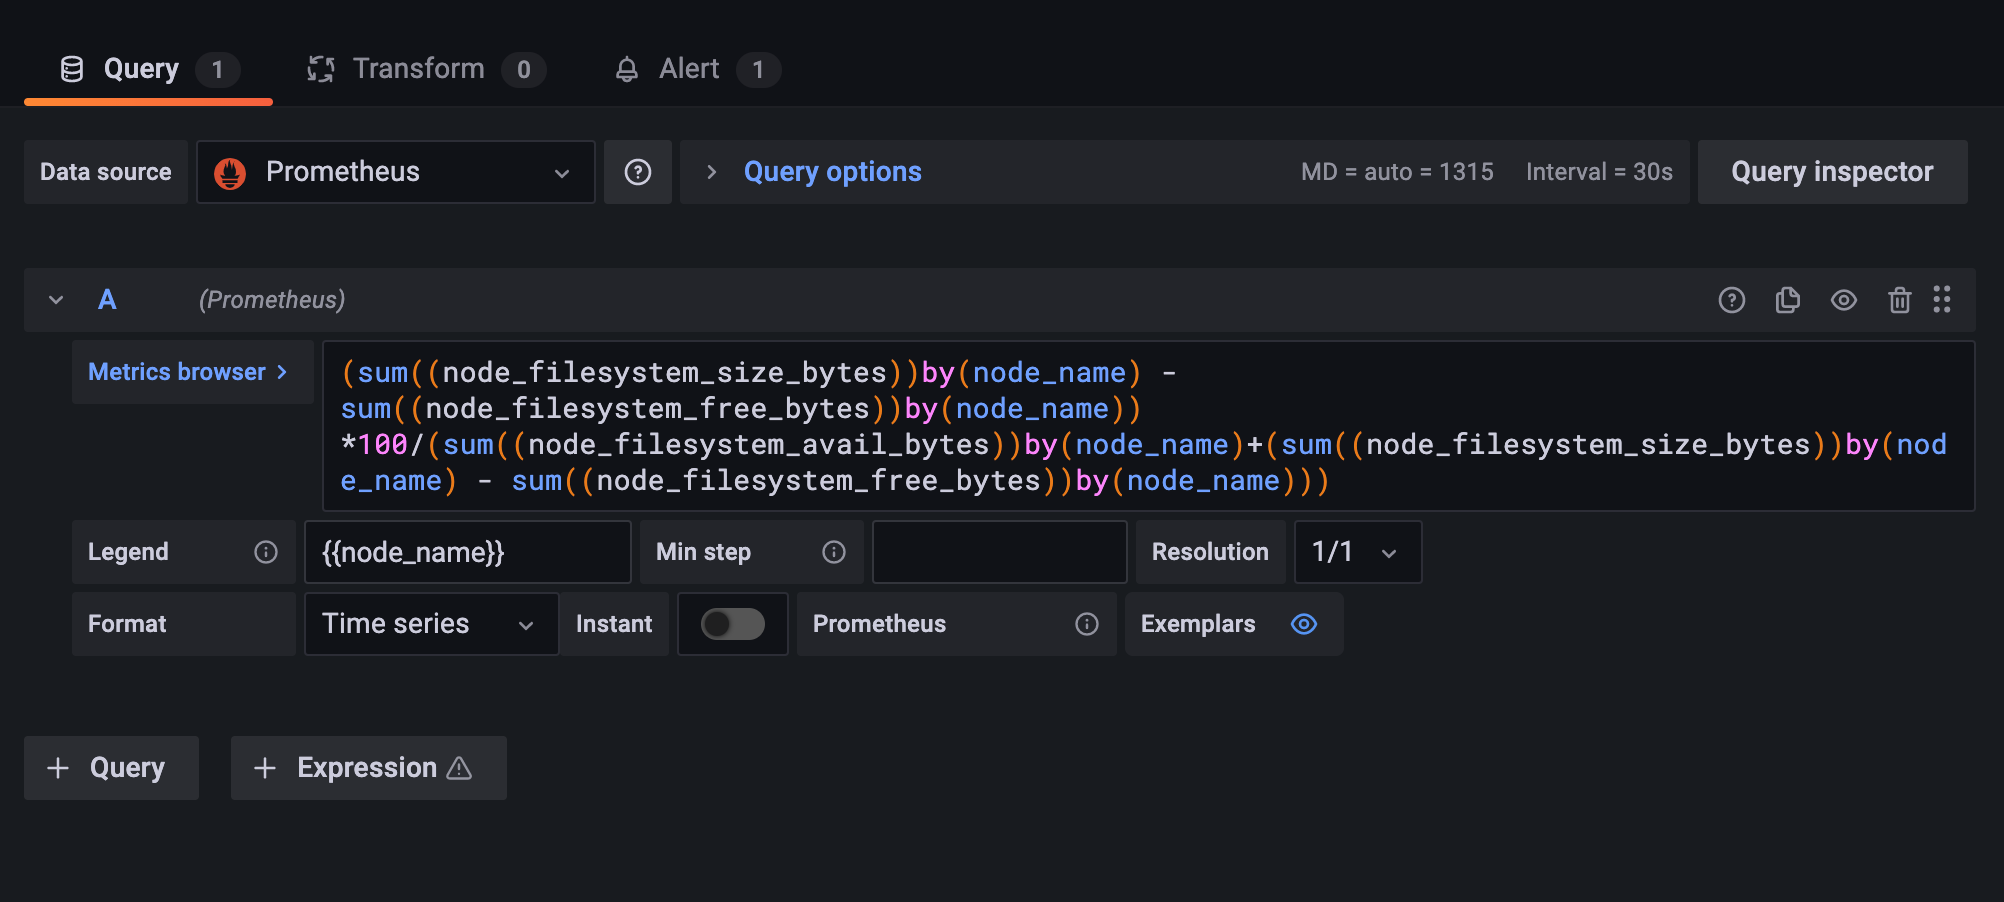
Dashboard query
You can use the following example queries to set up a dashboard that will capture Disk Usage by Node (Image 18)
(sum((node_filesystem_size_bytes))by(node_name) - sum((node_filesystem_free_bytes))by(node_name)) *100/(sum((node_filesystem_avail_bytes))by(node_name)+(sum((node_filesystem_size_bytes))by(node_name) - sum((node_filesystem_free_bytes))by(node_name)))
Alert
Set up your alert. This example uses a threshold limit of 80 (Image 17).
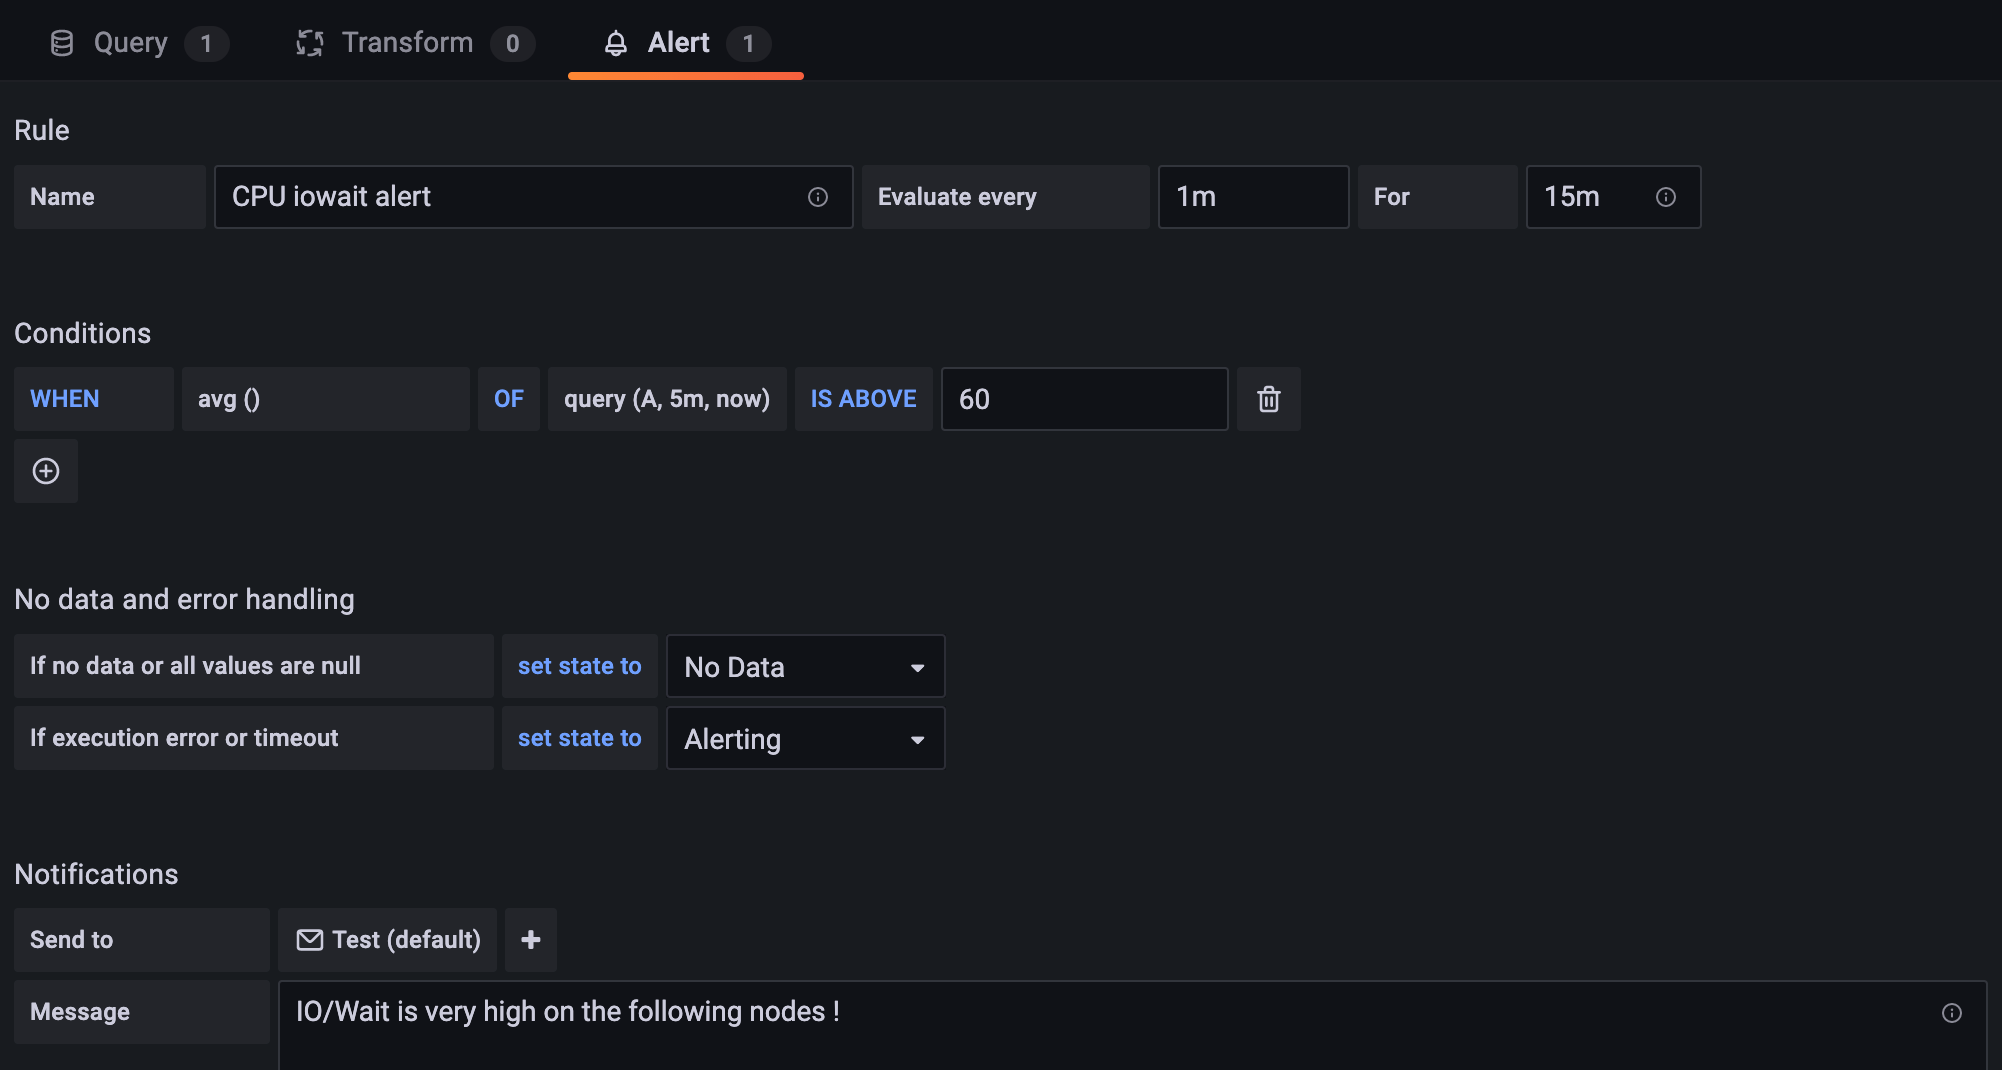
I/O wait
Set up this alert to check the amount of iowait from the CPU. A high value usually indicates a slow/overloaded HDD or Network.
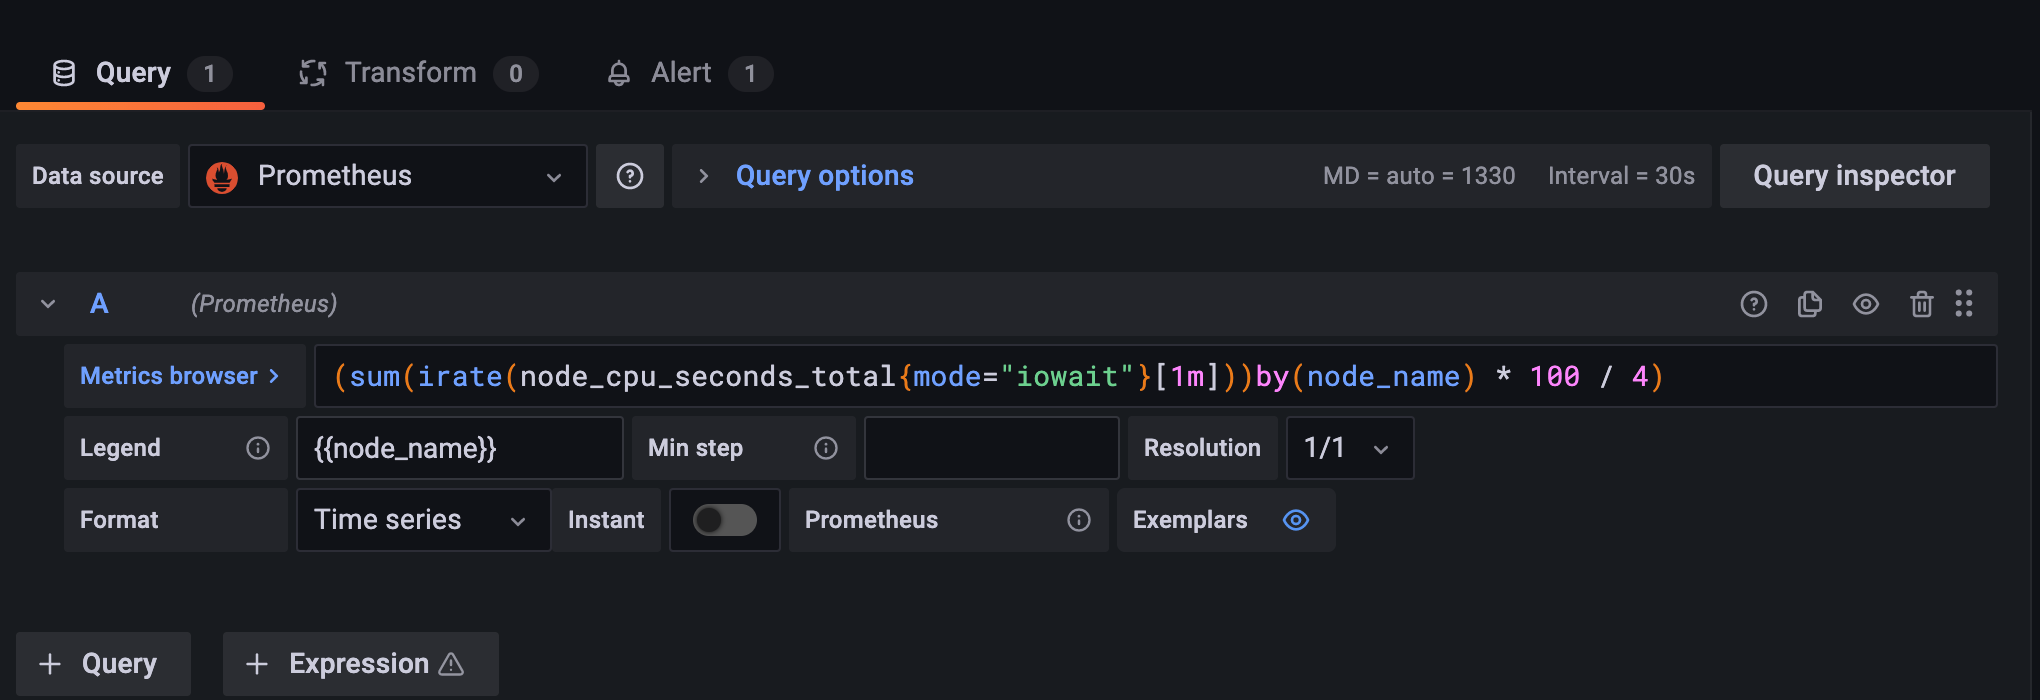
Dashboard query
You can use the following example queries to set up a dashboard that will capture the CPU I/O wait (Image 19).
(sum(irate(node_cpu_seconds_total{mode="iowait"}[1m]))by(node_name) * 100 / 4)
Alert
Set up your alert. This example uses a threshold limit of 60 (Image 19).
Update your Grafana password
This capability was added in Cinchy v5.4.
Your Grafana password can be updated in your deployment.json file (you may have renamed this during your original deployment).
- Navigate to cluster_component_config > grafana.
- The default password is set to prom-operator; update this with your preferred new password, written in clear text.
- Run the below command in the root directory of your devops.automations repository to update your configurations. If you have changed the name of your deployment.json file, make sure to update the command accordingly.
dotnet Cinchy.DevOps.Automations.dll "deployment.json"
-
Commit and push your changes.
-
If your environment isn't set-up to automatically apply upon configuration,navigate to the ArgoCD portal and refresh your component(s). If that doesn't work, re-sync.