OpenSearch Dashboards
Overview
When deploying Cinchy v5 on Kubernetes, Cinchy recommends using OpenSearch Dashboards for your logging. OpenSearch is a community-driven fork of Elasticsearch created by Amazon, and it captures and indexes all your logs into a single, accessible dashboard location. These logs can be queried, searched, and filtered, and Correlation IDs mean that they can also be traced across various components. These logging components take advantage of persistent storage.
You can view OpenSearch documentation here:
- Introducing OpenSearch
- General OpenSearch Documentation
- Using DQL (Dashboards Query Language)
- Troubleshooting and Common Errors
- Alerts
Get started with OpenSearch Dashboards
These sections guide you through setting up your first Index, Visualization, Dashboard, and Alert.
OpenSearch comes with sample data that you can use to get a feel of the various capabilities. You will find this on the main page upon logging in.
Define your log level
- Navigate to your
cinchy.kubernetes/environment_kustomizations/instance_template/worker/kustomization.yamlfile. - In the below code, copy the Base64 encoded string in the value parameter.
patch: |-
  - op: replace
    path: /data/appsettings.json
    value: wcxJItEmCWQJQPZidpLUuV6Ll79ZUr8BimlMJysLwcxJItEmCWQJQPZidpLUuV6Ll79ZUr8BimlMJysL
-
Decode the value to retrieve your AppSettings.
-
Navigate to the below Serilog section of the code and update the "Default" parameter as needed to set your log level. The options are:
-
VerboseVerbose is the noisiest level, rarely (if ever) enabled for a production app. DebugDebug is used for internal system events that aren't necessarily observable from the outside, but useful when determining how something happened.
This is the default setting for Cinchy.InformationInformation events describe things happening in the system that correspond to its responsibilities and functions. Generally these are the observable actions the system can perform. WarningWhen service is degraded, endangered, or may be behaving outside of its expected parameters, Warning level events are used. ErrorWhen functionality is unavailable or expectations broken, an Error event is used. FatalThe most critical level, Fatal events demand immediate attention.
-
"Serilog": {
    "MinimumLevel": {
      "Default": "Debug",
- Ensure that you commit your changes.
- Navigate to ArgoCD > Worker Application and refresh.
Common log search patterns
The following are some common search patterns when looking through your OpenSearch Logs.
- If an HTTP request to Cinchy Web/IDP fails, check the page's requests and the relevant response headers to find the "x-correlation-id" header. That header value can be used to search and find all logs associated with the HTTP request.
- When debugging batch syncs, filter the "ExecutionId" field in the logs for your batch sync execution ID to narrow down your search.
- When debugging real time syncs, search for your data sync config name in the Event Listener or Workers logs to find all the associated logging information.
Set up an index
The first step to utilizing the power of OpenSearch Dashboards is to set up an index to pull data from your sources. An Index Pattern identifies which indices you want to explore. An index pattern can point to a specific index, for example, your log data from yesterday, or all indices that contain your log data.
- Login to OpenSearch. You would have configured the access point during your deployment installation; traditionally it will be found at
<baseurl>/dashboard.
If this is your first time logging in, the username and password will be set to admin/admin.
We highly recommend you update the password as soon as possible.
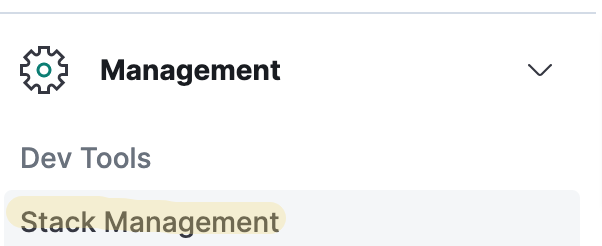
- Navigate to the Stack Management tab in the left navigation menu (Image 1).
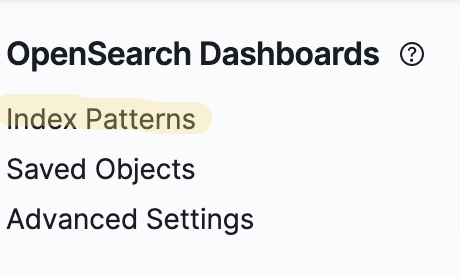
- From the left navigation, click on Index Patterns (Image 2).
-
Click on the Create Index Pattern button.
-
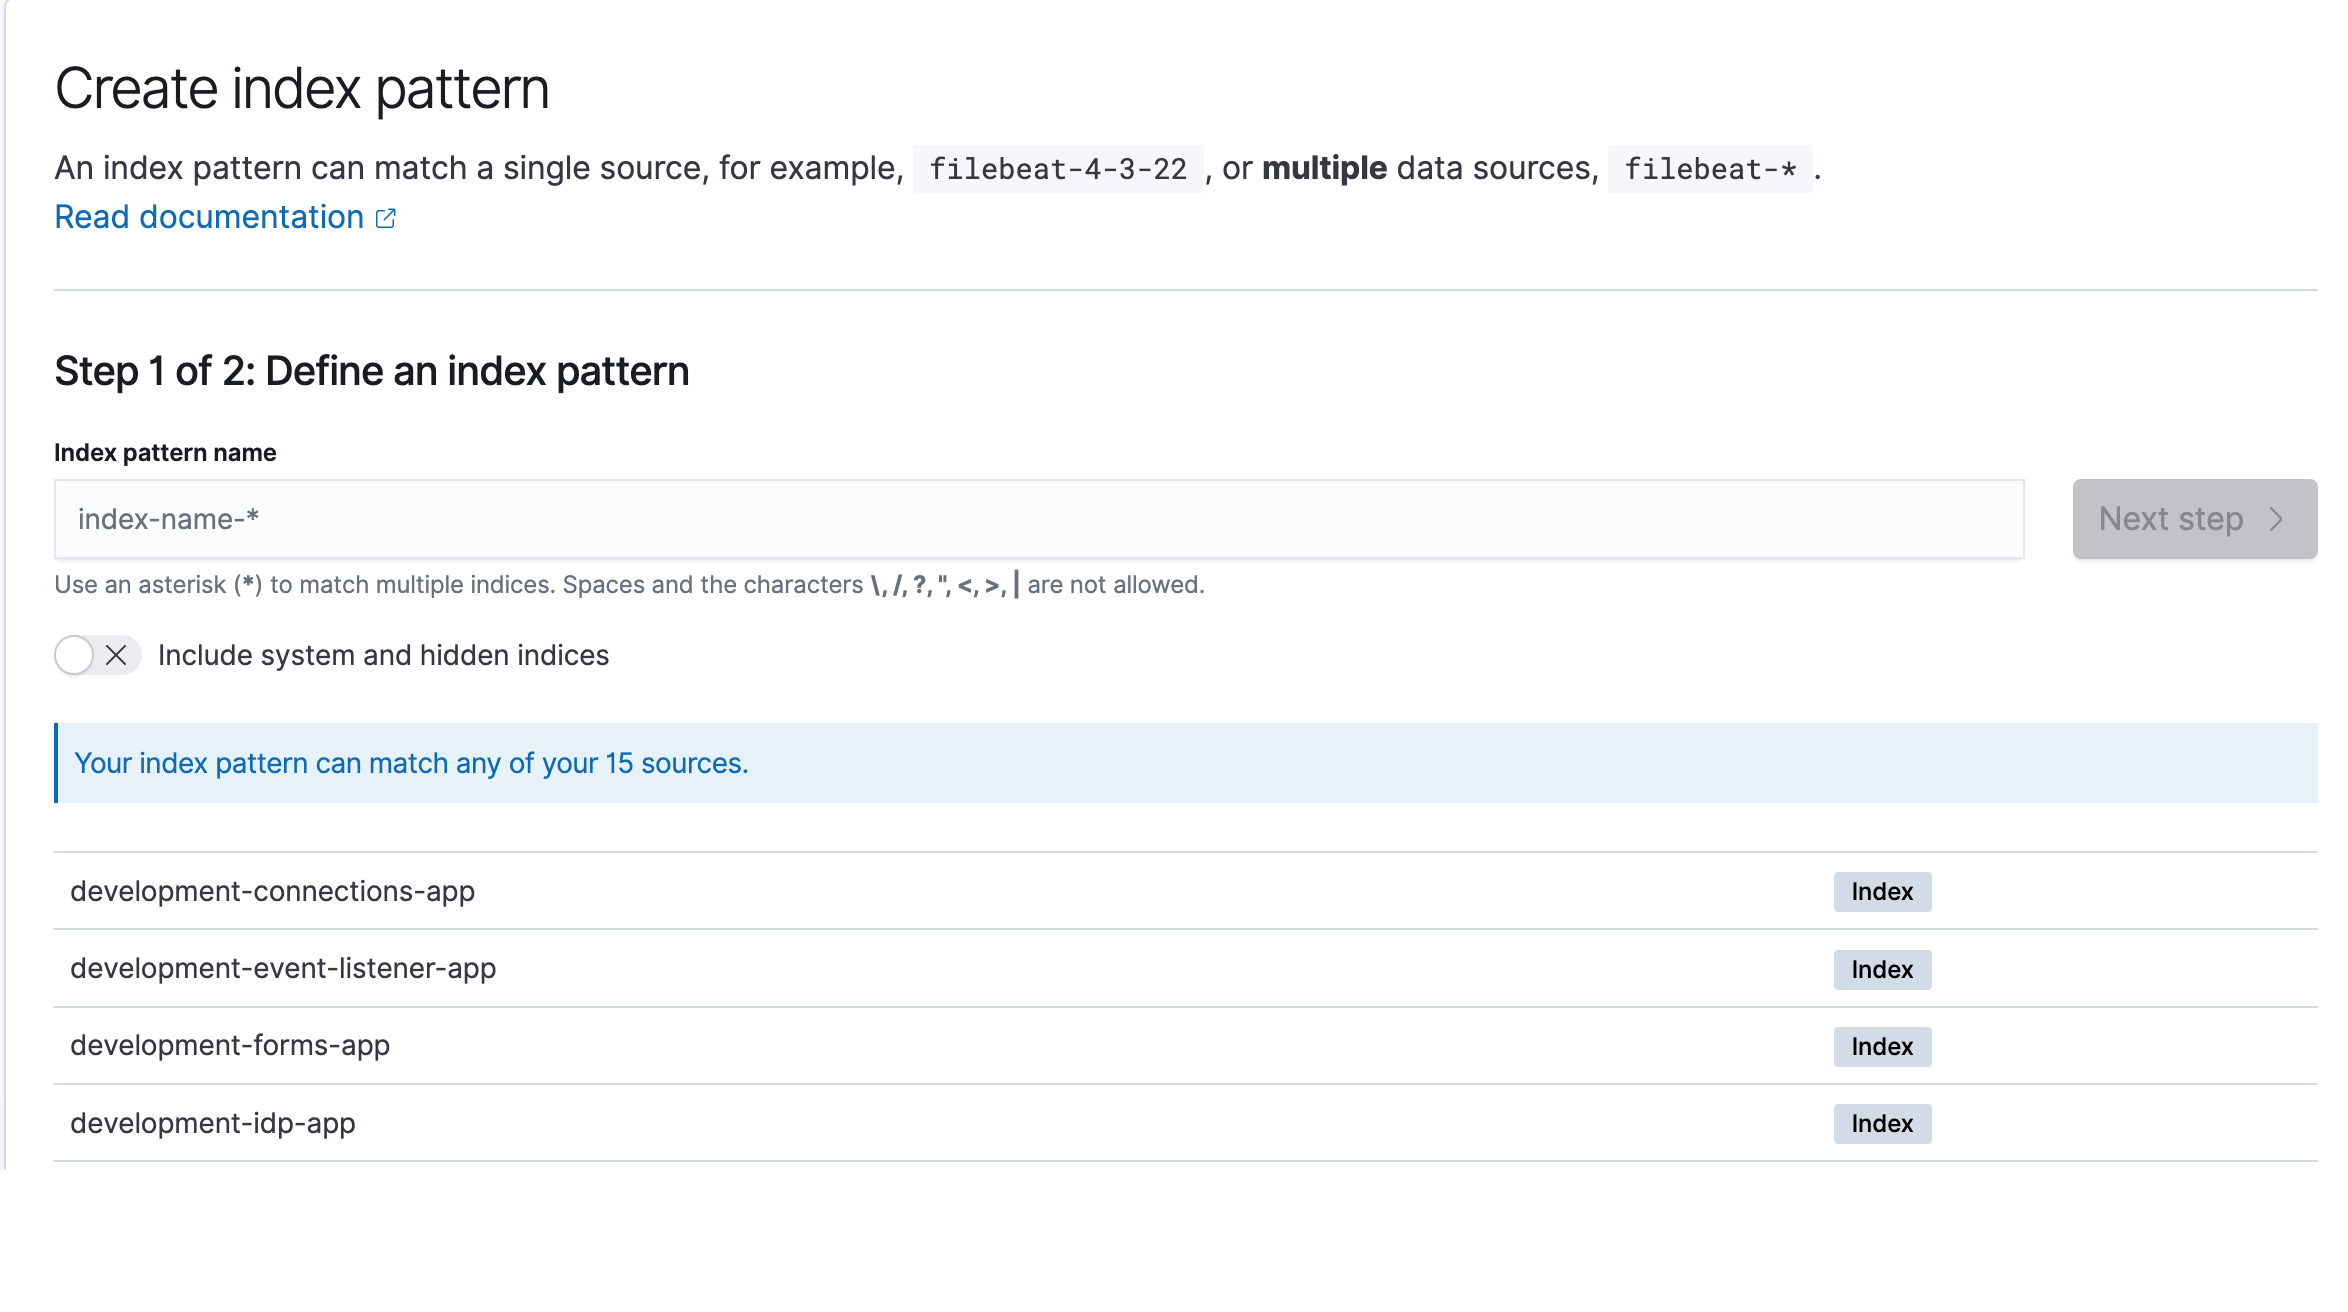
To set up your index pattern, you must define the source. OpenSearch will list the sources available to you on the screen below. Input your desired source(s) in the text box (Image 3).
You can use the asterisk (*) to match multiple sources.
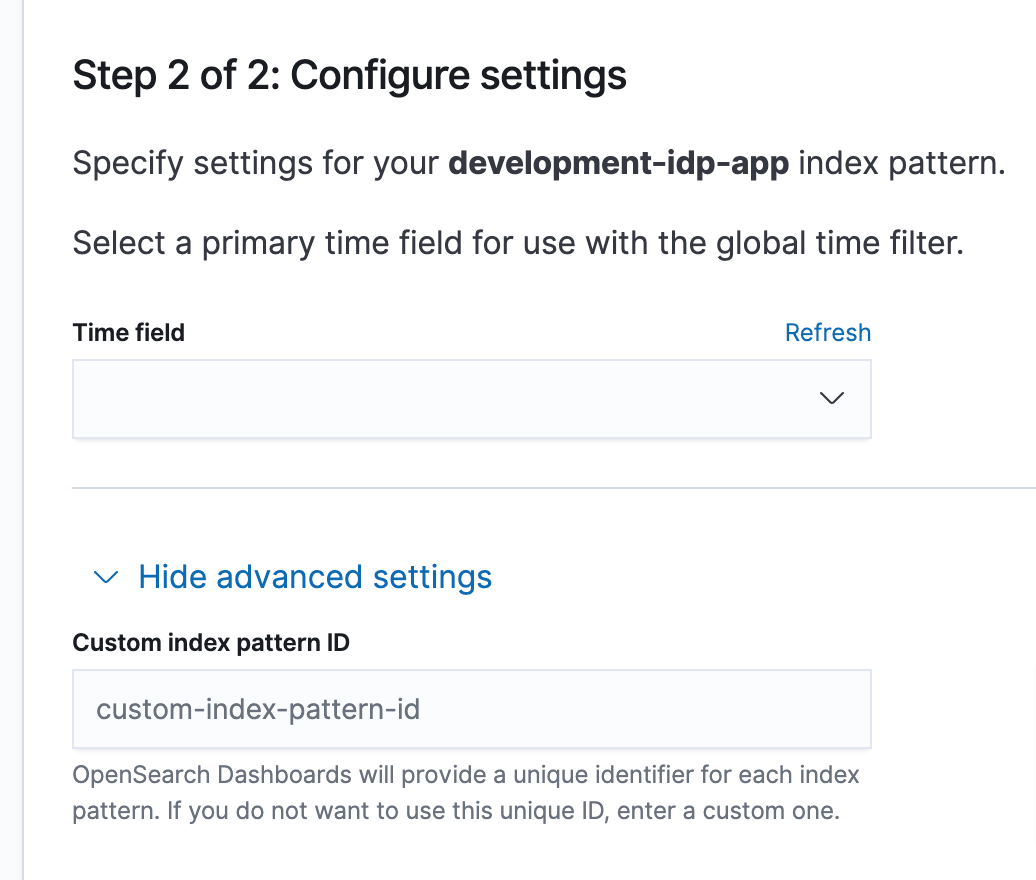
- Configure your index pattern settings (Image 4).
- Time field: Select a primary time field to use with the global time filter
- Custom index pattern ID: By default, OpenSearch gives a unique identifier to each index pattern. You can use this field to optional override the default ID with a custom one.
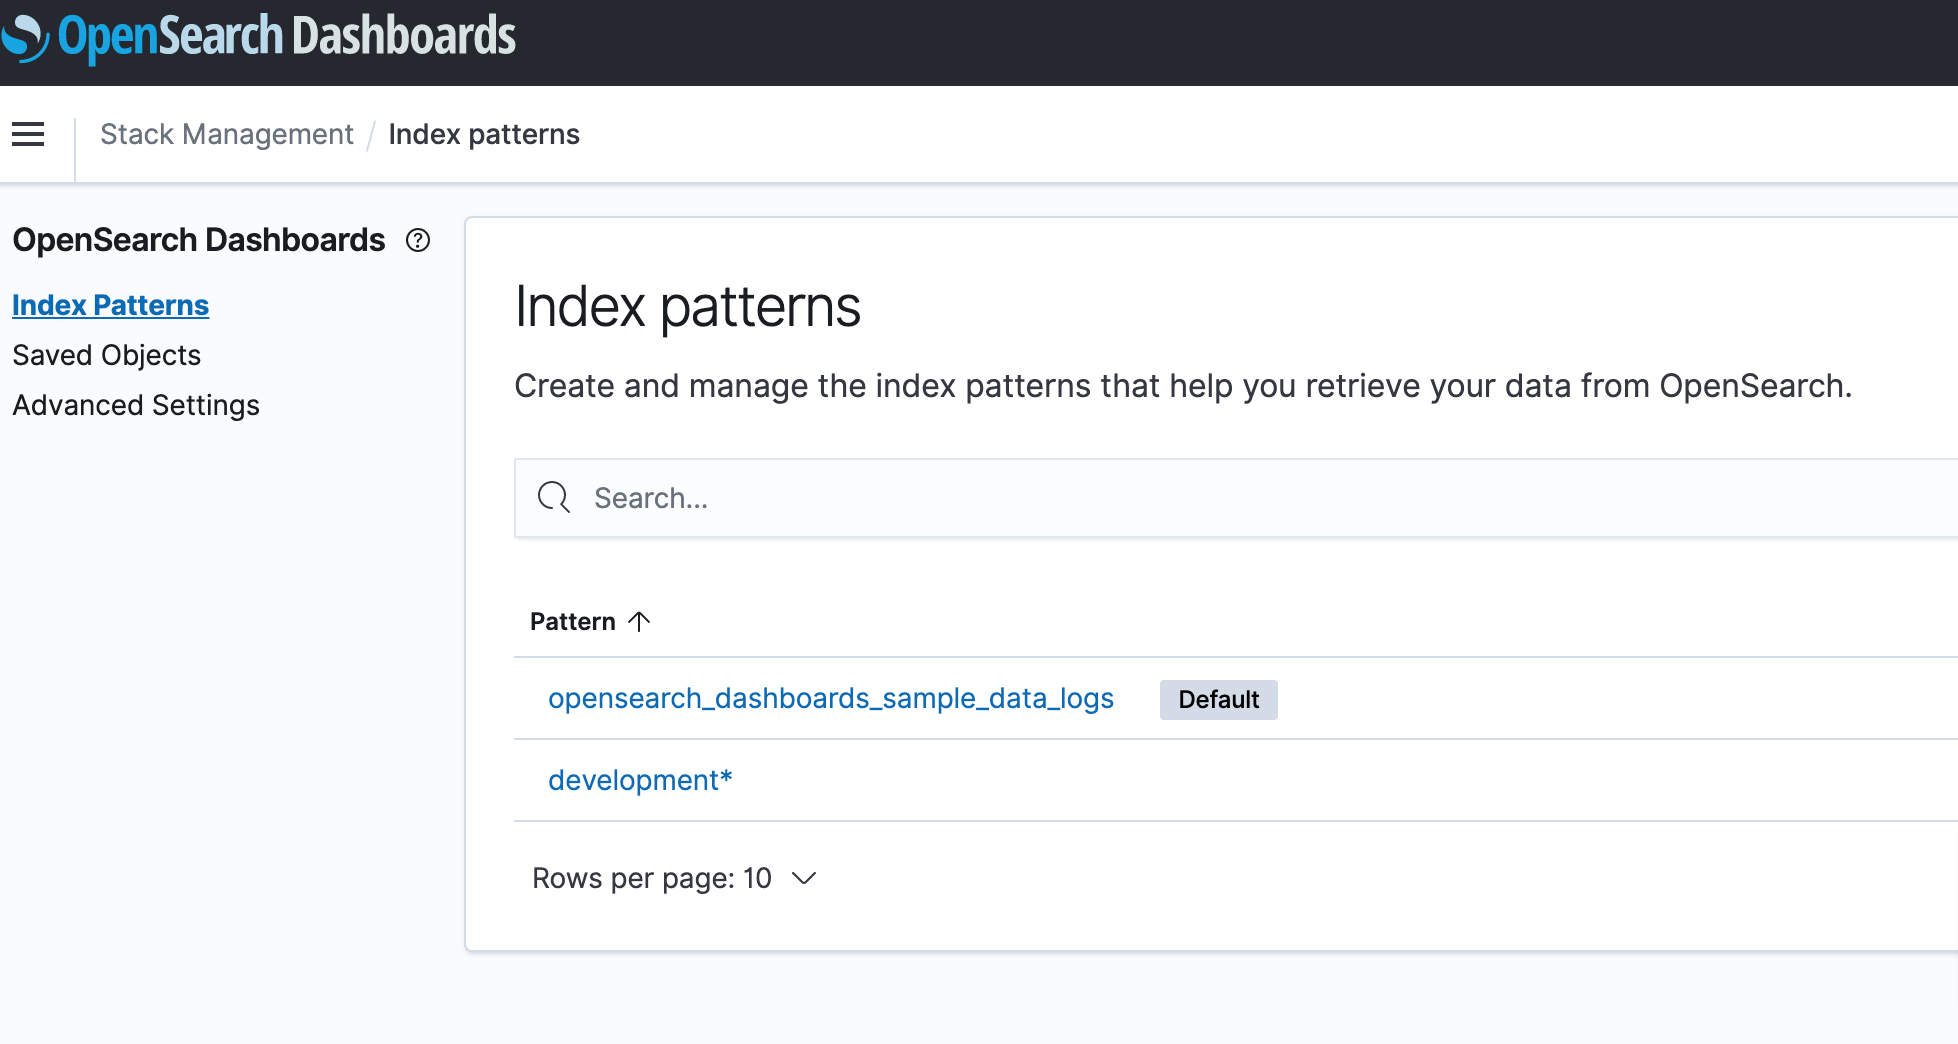
- Once created, you can review your Index Patterns from the Index Patterns page (Image 5).
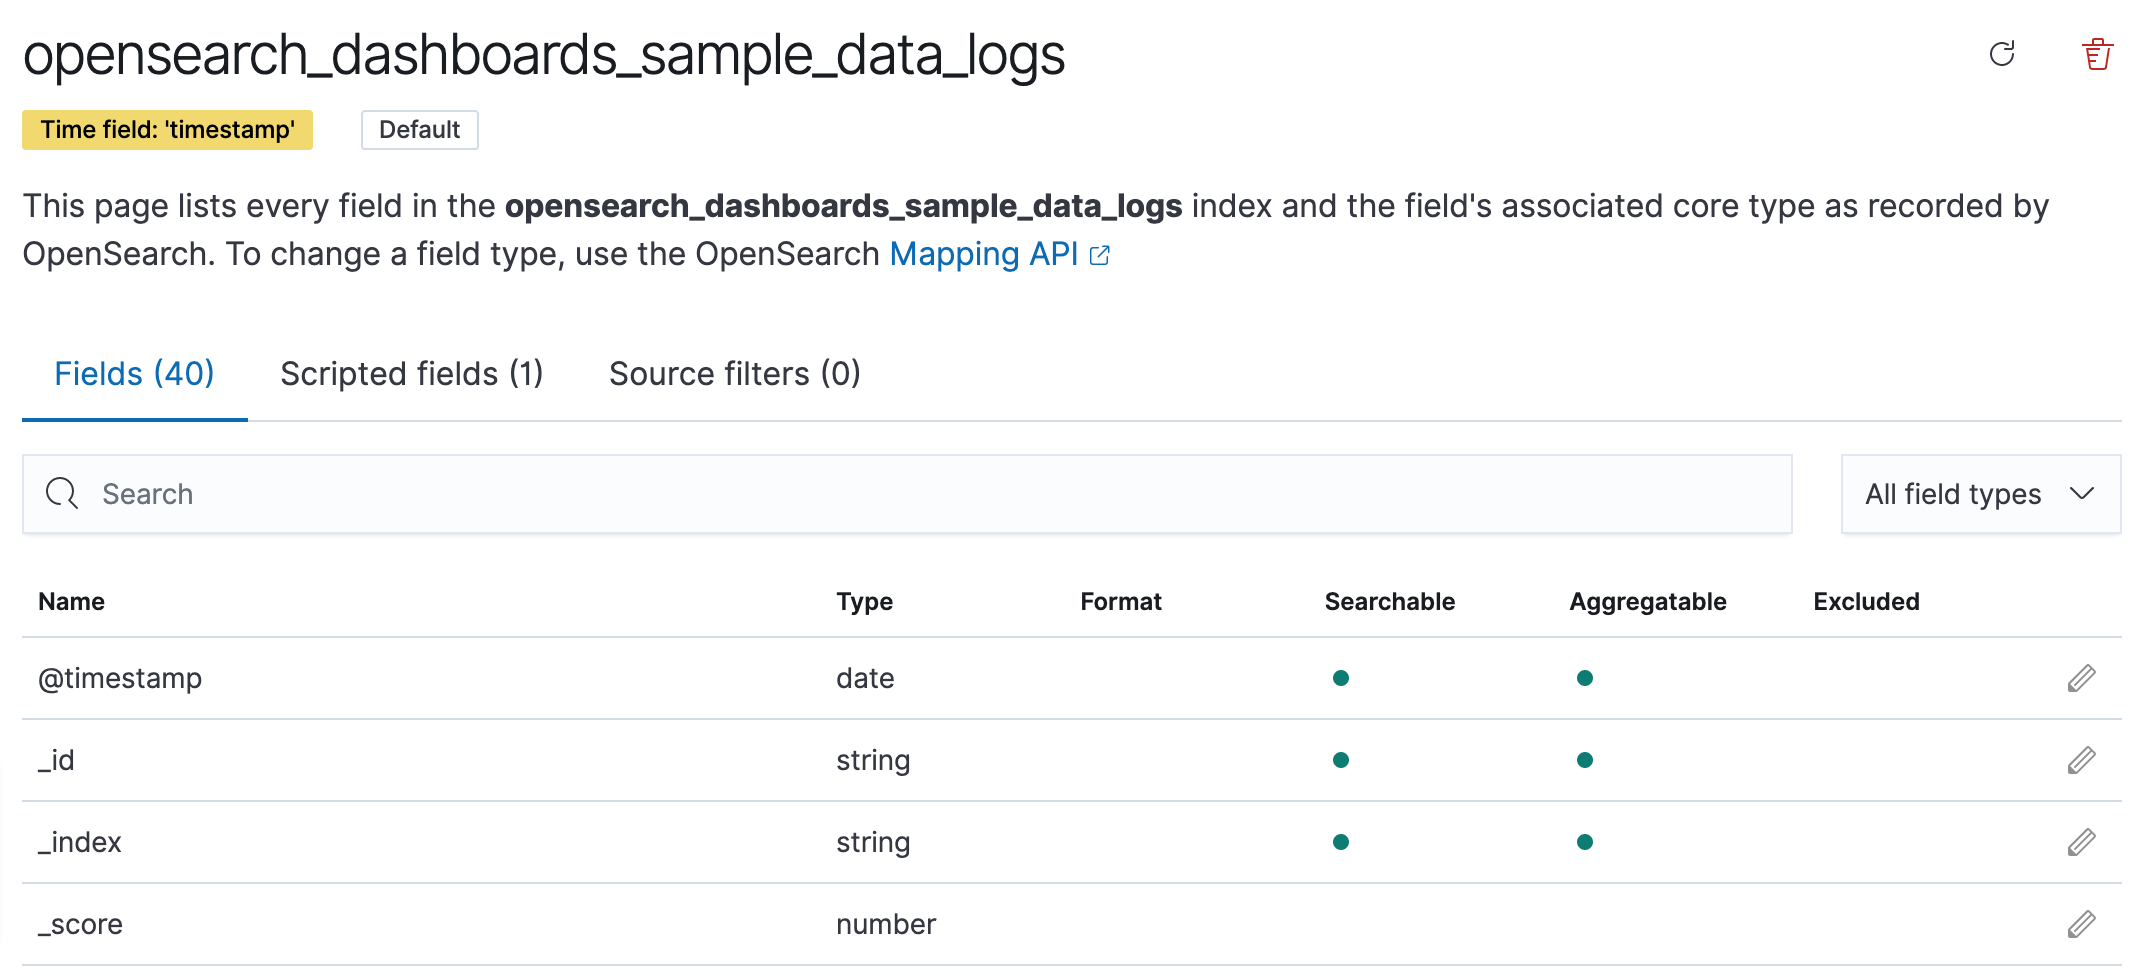
- Click on your Index Pattern to review your fields (Image 6).
Create a visualization
You can pull out any data from your index sources and view them in a variety of visualizations.
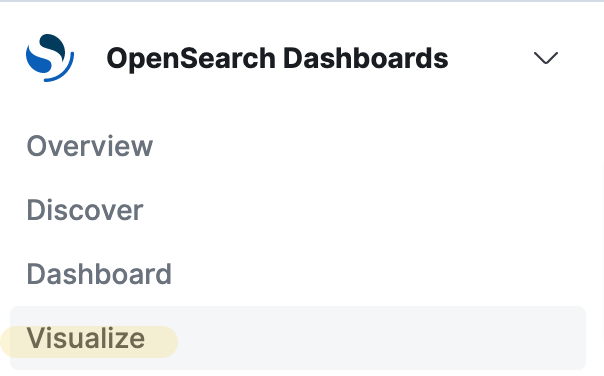
- From the left navigation pane, click Visualize (Image 7).
 2. If you have any Visualizations, they will appear on this page. To create a new one, click the Create Visualization button (Image 8).

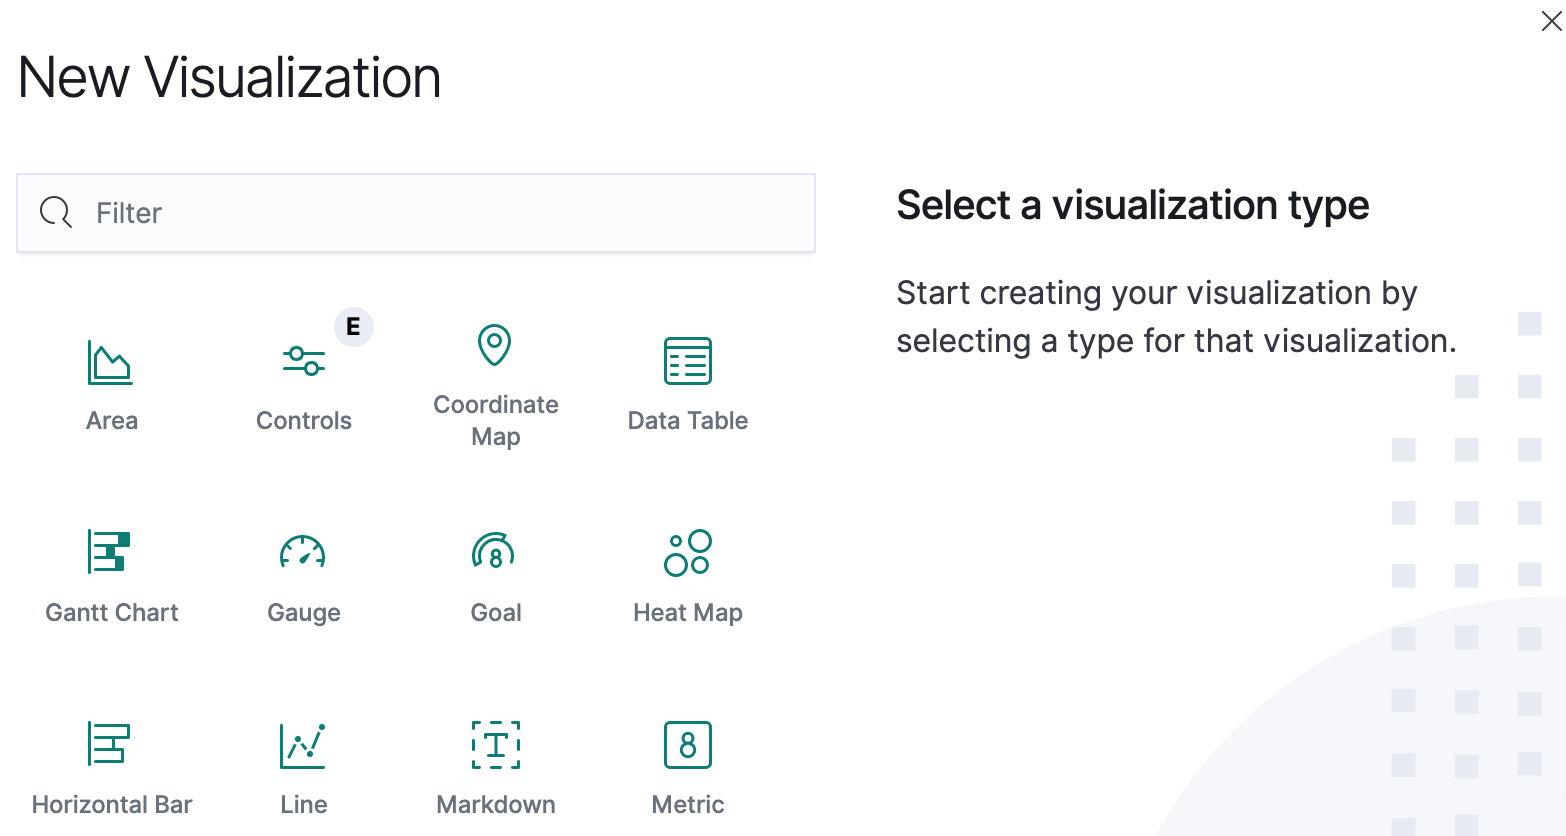
- Select your visualization type from the populated list (Image 9).
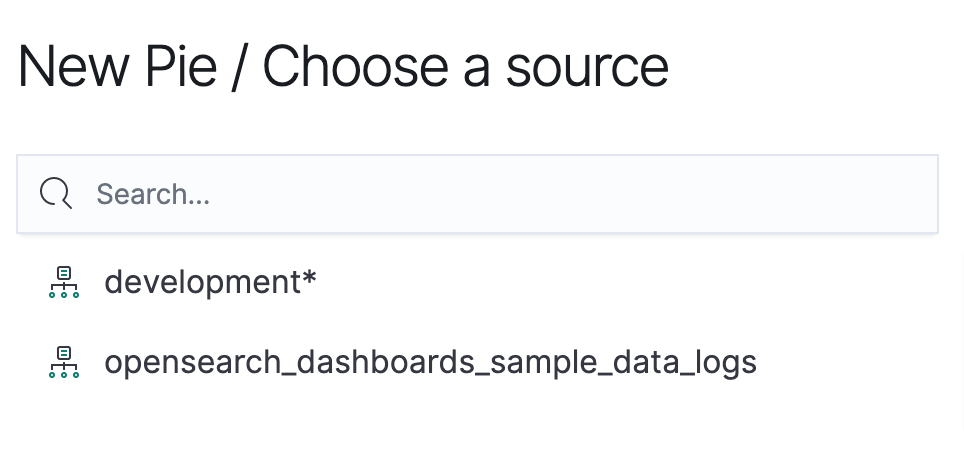
- Choose your source (Image 10). If the source you want to pull data from isn't listed, you will need to set it up as an index first.
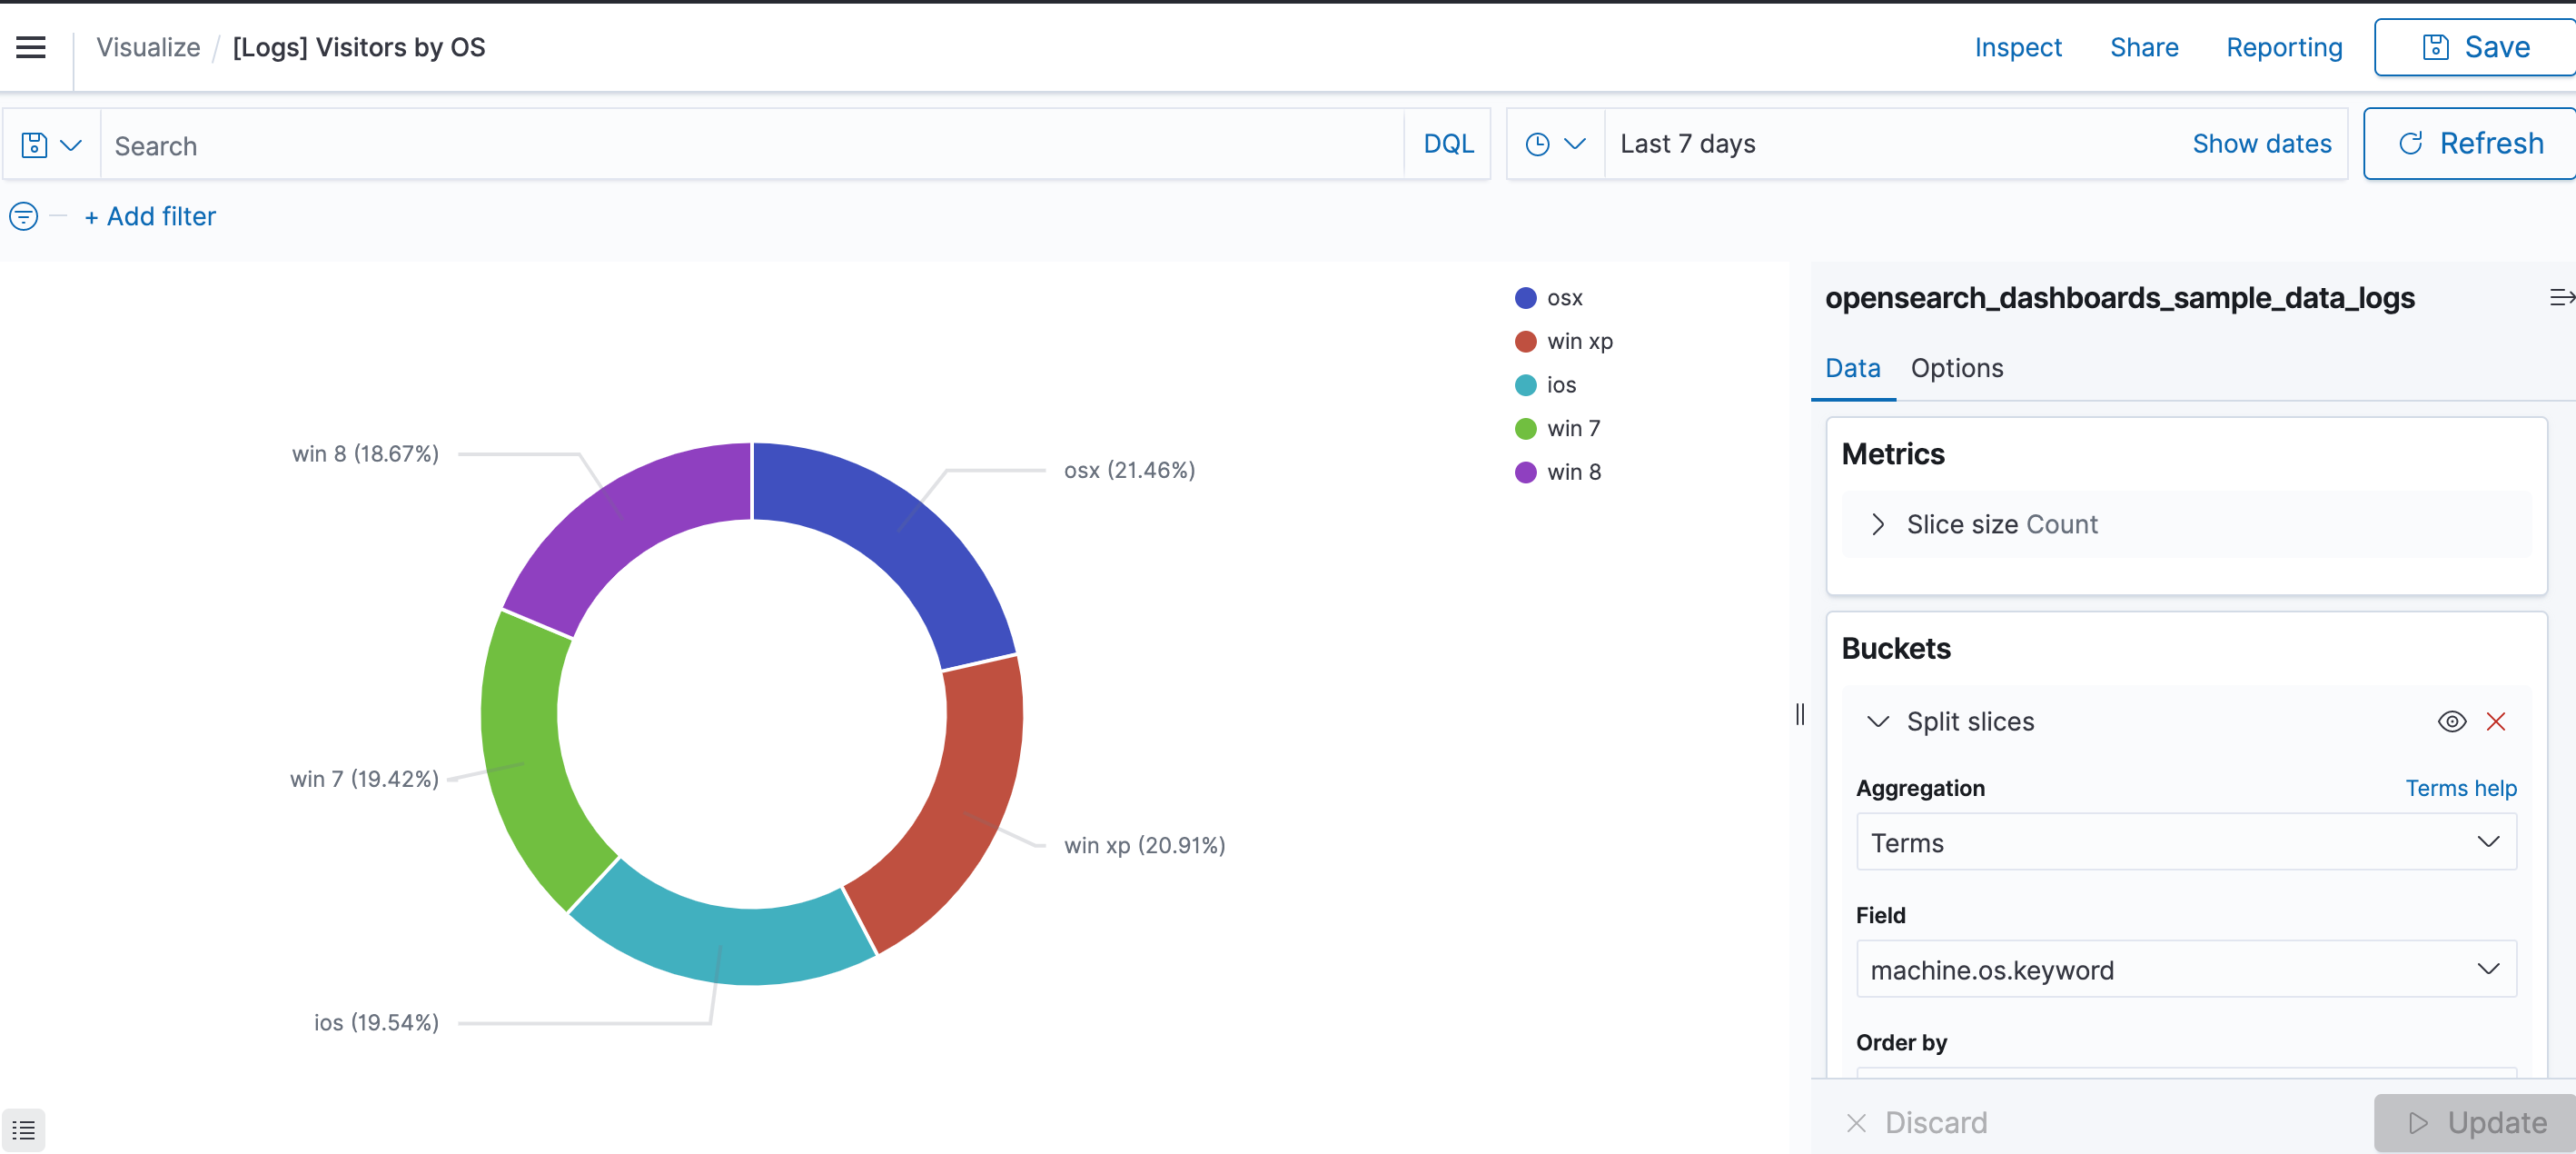
- Configure the data parameters that appear in the right hand pane of the Create screen. These options will vary depending on what type of visualization you choose in step 3. The following example uses a pie chart visualization (Image 11):
- Metrics
- Aggregation: Choose how you want your data aggregated. This example uses Count.
- Custom Label: You can use this optional field for custom labelling.
- Buckets
- Aggregation: Choose how you want your data aggregated. This example uses Split Slices > Terms.
- Field: This drop down is populated based on the index source your chose. Select which field you want to use in your visualization. This example uses machine.os.keyword.
- Order By: Define how you want your data to be ordered. This example uses Metric: Count, in descending order of size 10.
- Choose whether to group other values in a separate bucket. If you toggle this on, you will need to label the new bucket.
- Choose whether to show missing values.
- Advanced
- You can optionally choose a JSON input. These will be merged with the OpenSearch aggregation definition.
- Options
- The variables in the options tab can be used to configure the UI of the visualization itself.
- You can also further focus your visualization:
- Use DQL to search your index data (Image 12). You can also save any queries you write for easy access by clicking on the save icon.

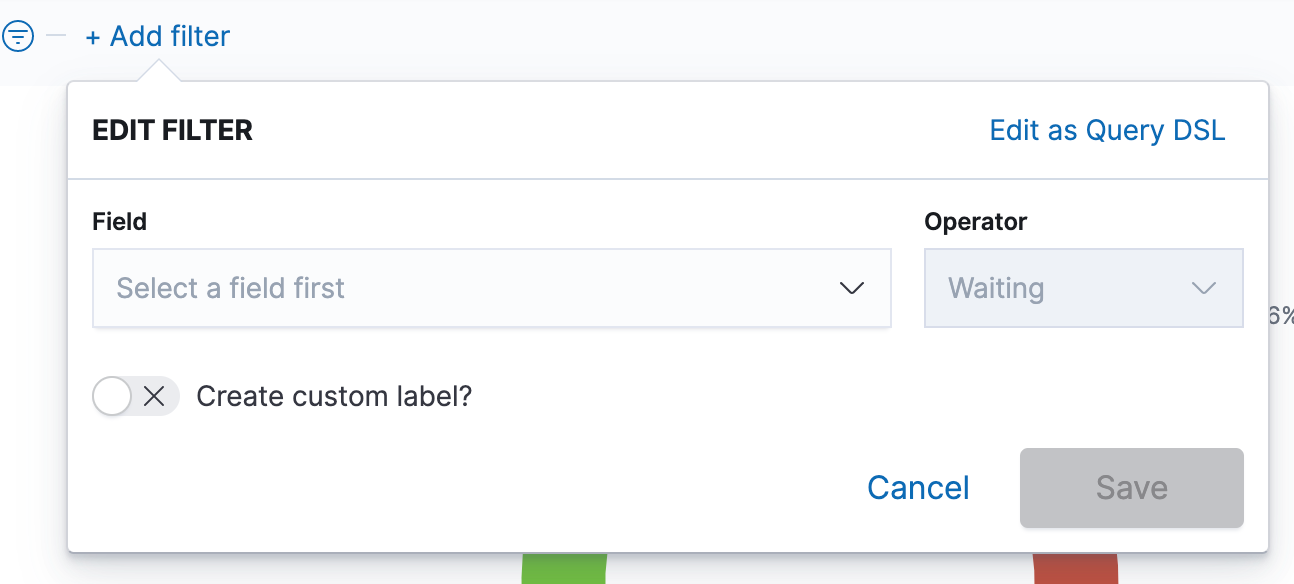
- Add a filter on any of your fields (Image 13).
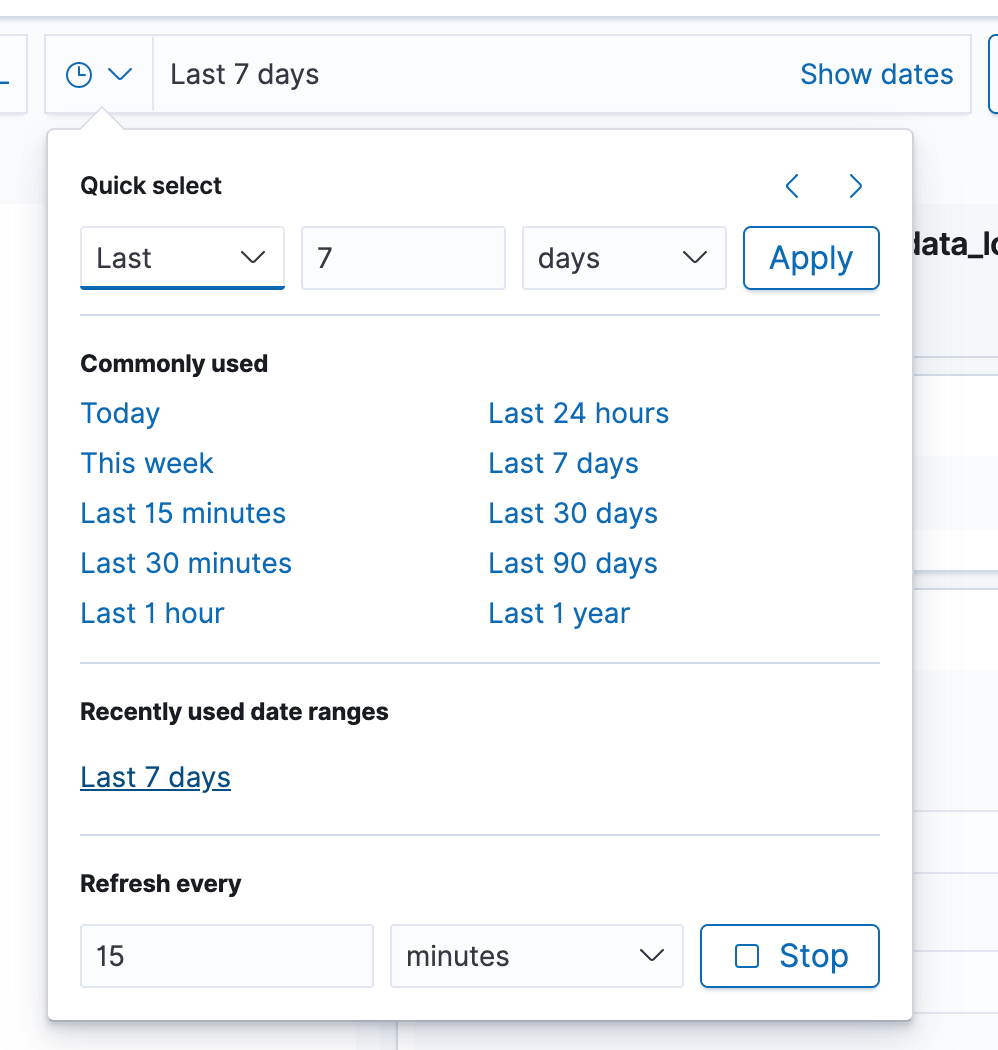
- Update your date filter (Image 14).
- Click save when finished with your visualization.
Create a dashboard
Once you have created your visualizations, you can combine them together on one Dashboard for easy access.
You can also create new visualizations from the Dashboard screen.
- From the left navigation pane, click on Dashboards (Image 15).
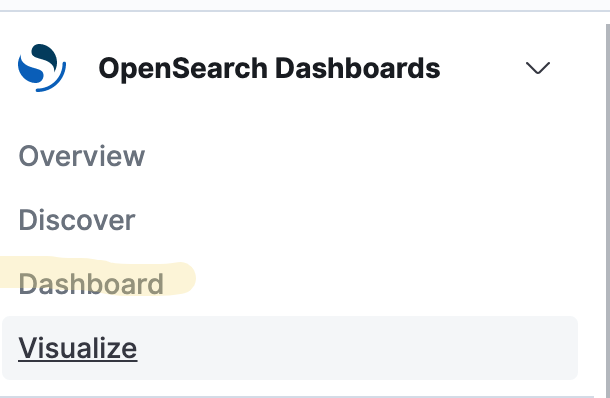
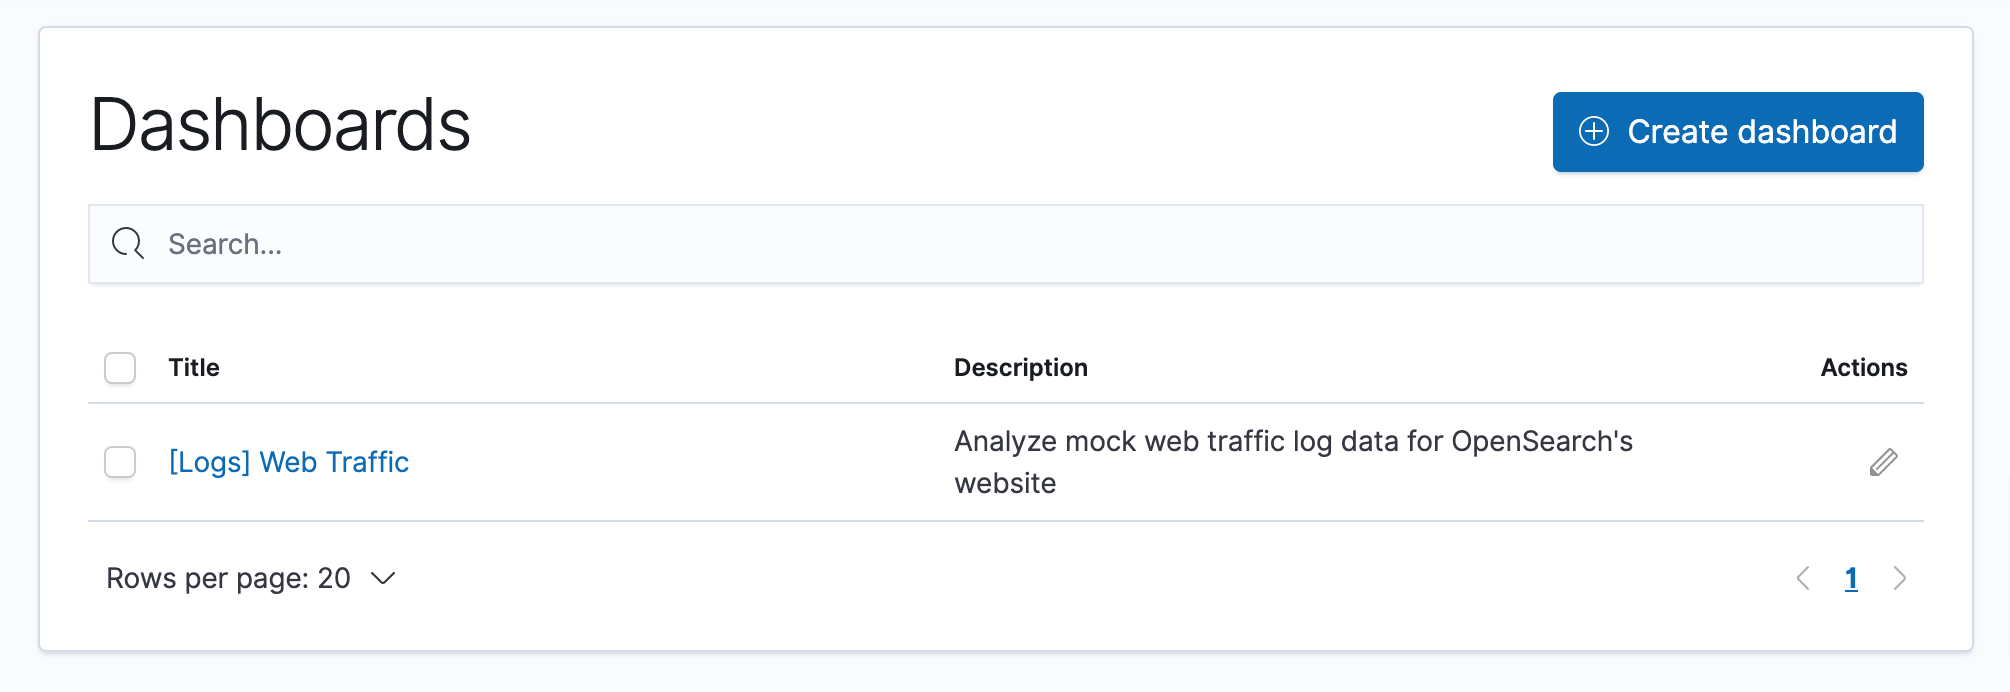
- If you have any Dashboards, they will appear on this page. To create a new one, click the Create Dashboard button (Image 16).
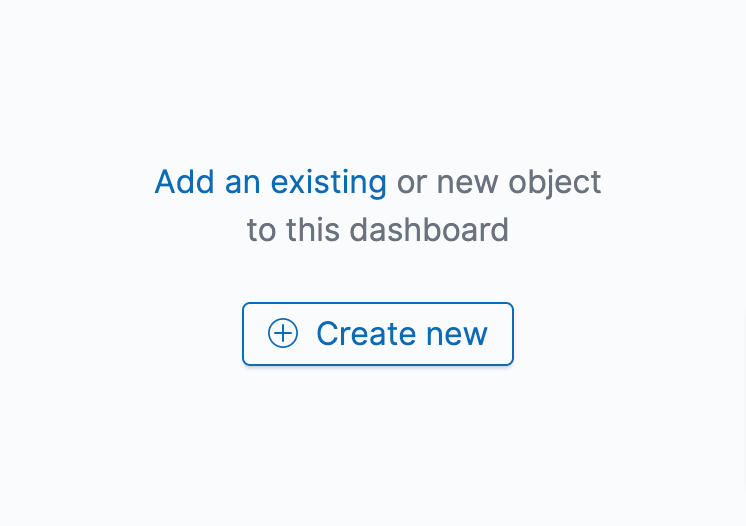
- The "Editing New Dashboard" screen will appear. Click on Add an Existing object (Image 17).
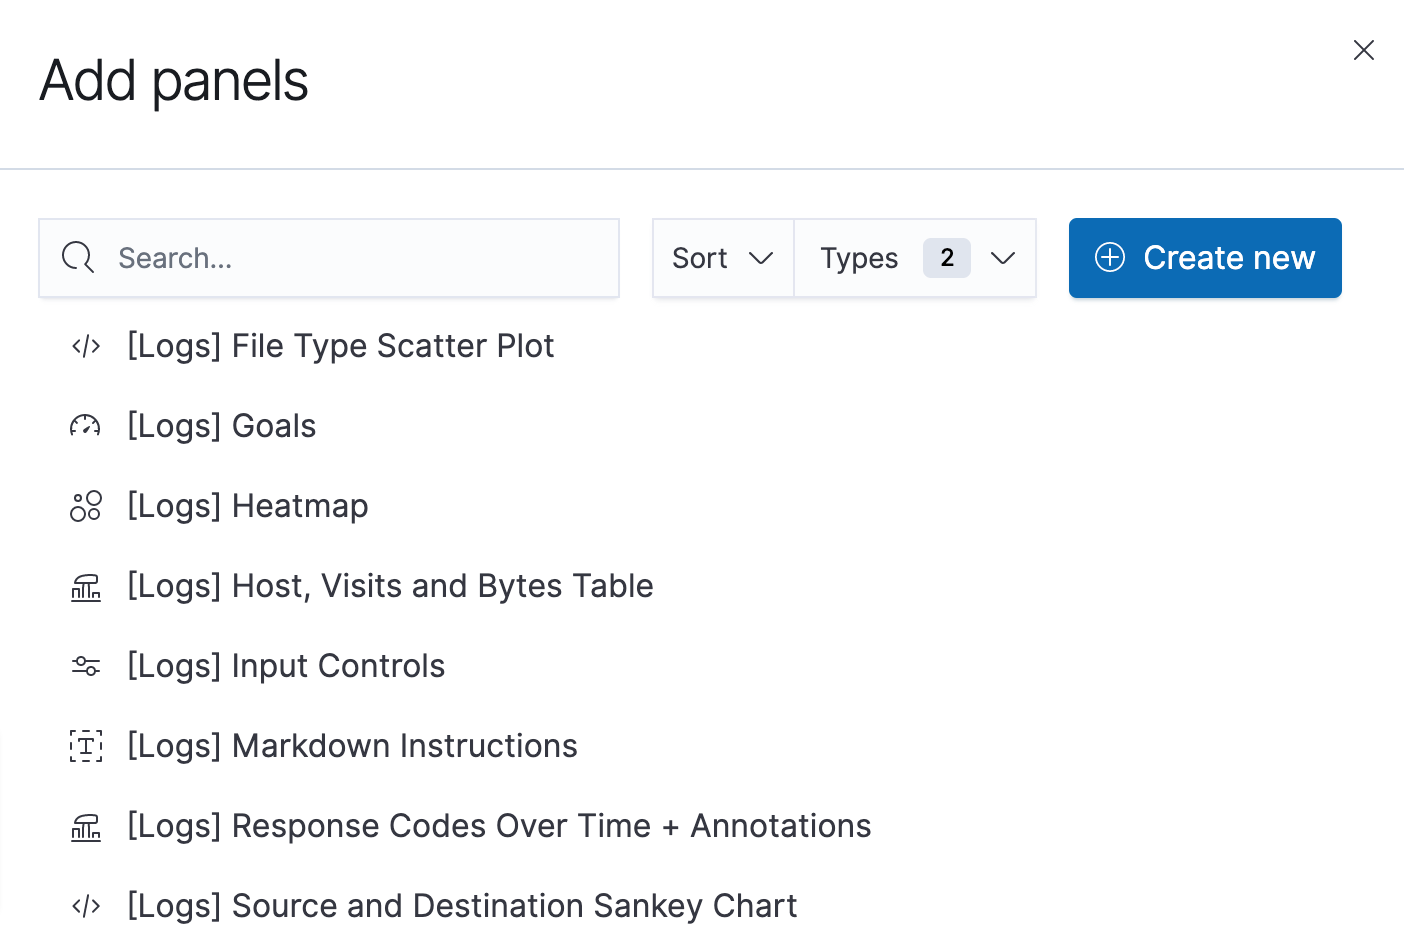
- Select any of the visualizations you created and it will automatically add to your Dashboard (Image 18). Repeat this step for as many visualizations as you'd like to appear.
- Click Save to finish (Image 19).

Update your OpenSearch password
This capability was added in Cinchy v5.4.
Your OpenSearch password can be updated in your deployment.json file (you may have renamed this during your original deployment).
-
Navigate to "cluster_component_config > OpenSearch.
-
OpenSearch has two users that you can configure the passwords for: Admin and Kibana Server. Kibana Server is used for communication between the opensearch dashboard and the opensearch server. The default password for both is set to "password";. To update this, you will need to use a machine with docker available.
-
Update your Admin password:
- Your password must be hashed. You can do so by running the following command on a machine with docker available, inputting your new password where noted:
docker run -it opensearchproject/opensearch /usr/share/opensearch/plugins/opensearch-security/tools/hash.sh -p <<newpassword>>-
Navigate to "opensearch_admin_user_hashed_password" and input your hashed password.
-
You must also provide your password in a base64 encoded format; input your cleartext password here to receive your new encoded password.
-
Navigate to "opensearch_admin_user_password_base64" and input your encoded password.
-
Update your Kibana Server password:
- Your password must be hashed. You can do so by running the following command on a machine with docker available, inputting your new password where noted:
docker run -it opensearchproject/opensearch /usr/share/opensearch/plugins/opensearch-security/tools/hash.sh -p <<newpassword>>-
Navigate to "opensearch_kibanaserver_user_hashed_password" and input your hashed password.
-
You must also provide your new password in cleartext. Navigate to "opensearch_kibanaserver_user_password" and input your cleartext password.
-
Run the below command in the root directory of your devops.automations repo to update your configurations. If you have changed the name of your deployment.json file, make sure to update the command accordingly.
dotnet Cinchy.DevOps.Automations.dll "deployment.json" -
Commit and push your changes.
-
If your environment isn't set-up to automatically apply upon configuration,navigate to the ArgoCD portal and refresh your component(s). If that doesn't work, re-sync.