Monitoring via ArgoCD
ArgoCD Overview
ArgoCD is implemented as a Kubernetes controller which continuously monitors running applications and compares the current, live state against the desired target state (as specified in your Git repository).
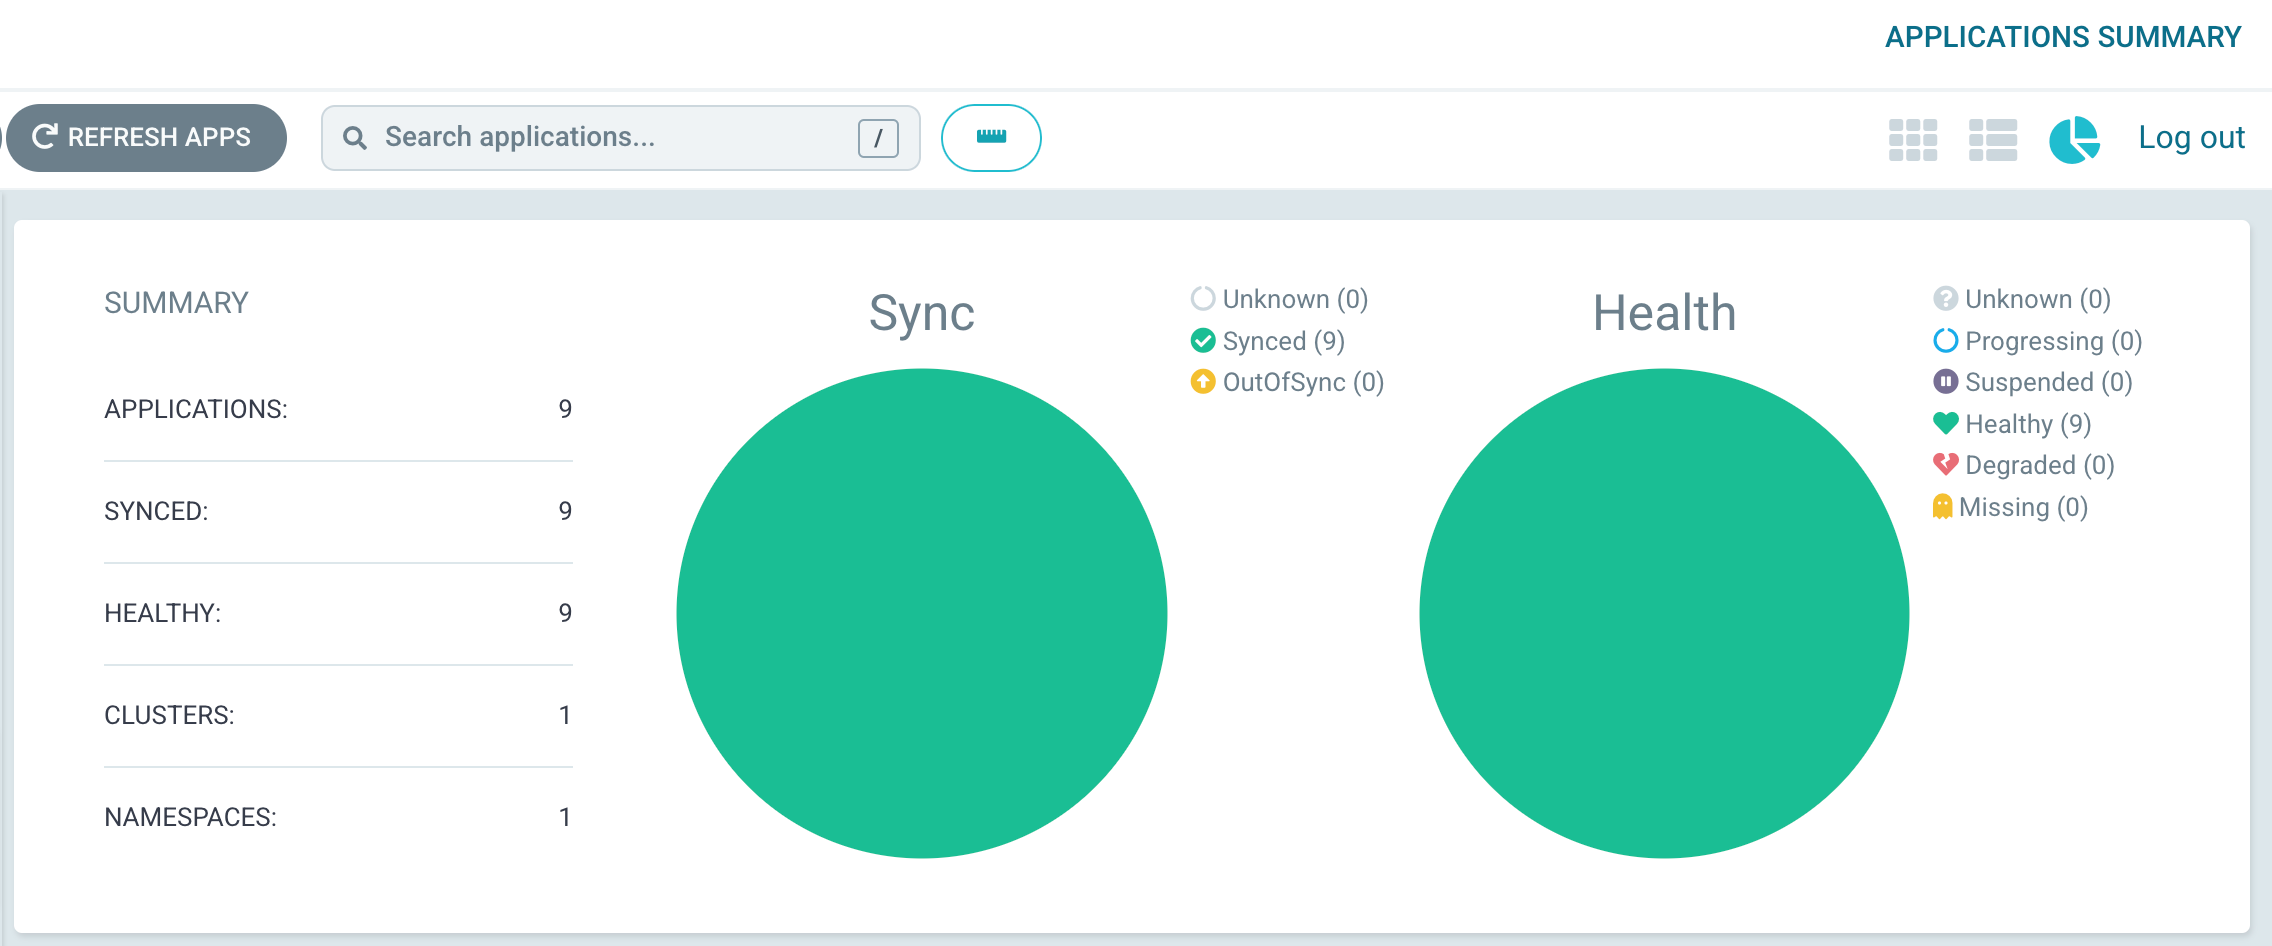
You can use ArgoCD's dashboard (Image 1) to visually monitor your namespaces and pods, and to quickly visualize deployment issues. It can easily show you what your cluster or pods are doing, and if they're healthy.
Get started with ArgoCD
ArgoCD has a robust set of documentation that can help you to get started with the application. We recommend the following two pages:
ArgoCD dashboard
Your ArgoCD dashboard has a lot of important information about how your Cinchy instance is behaving.
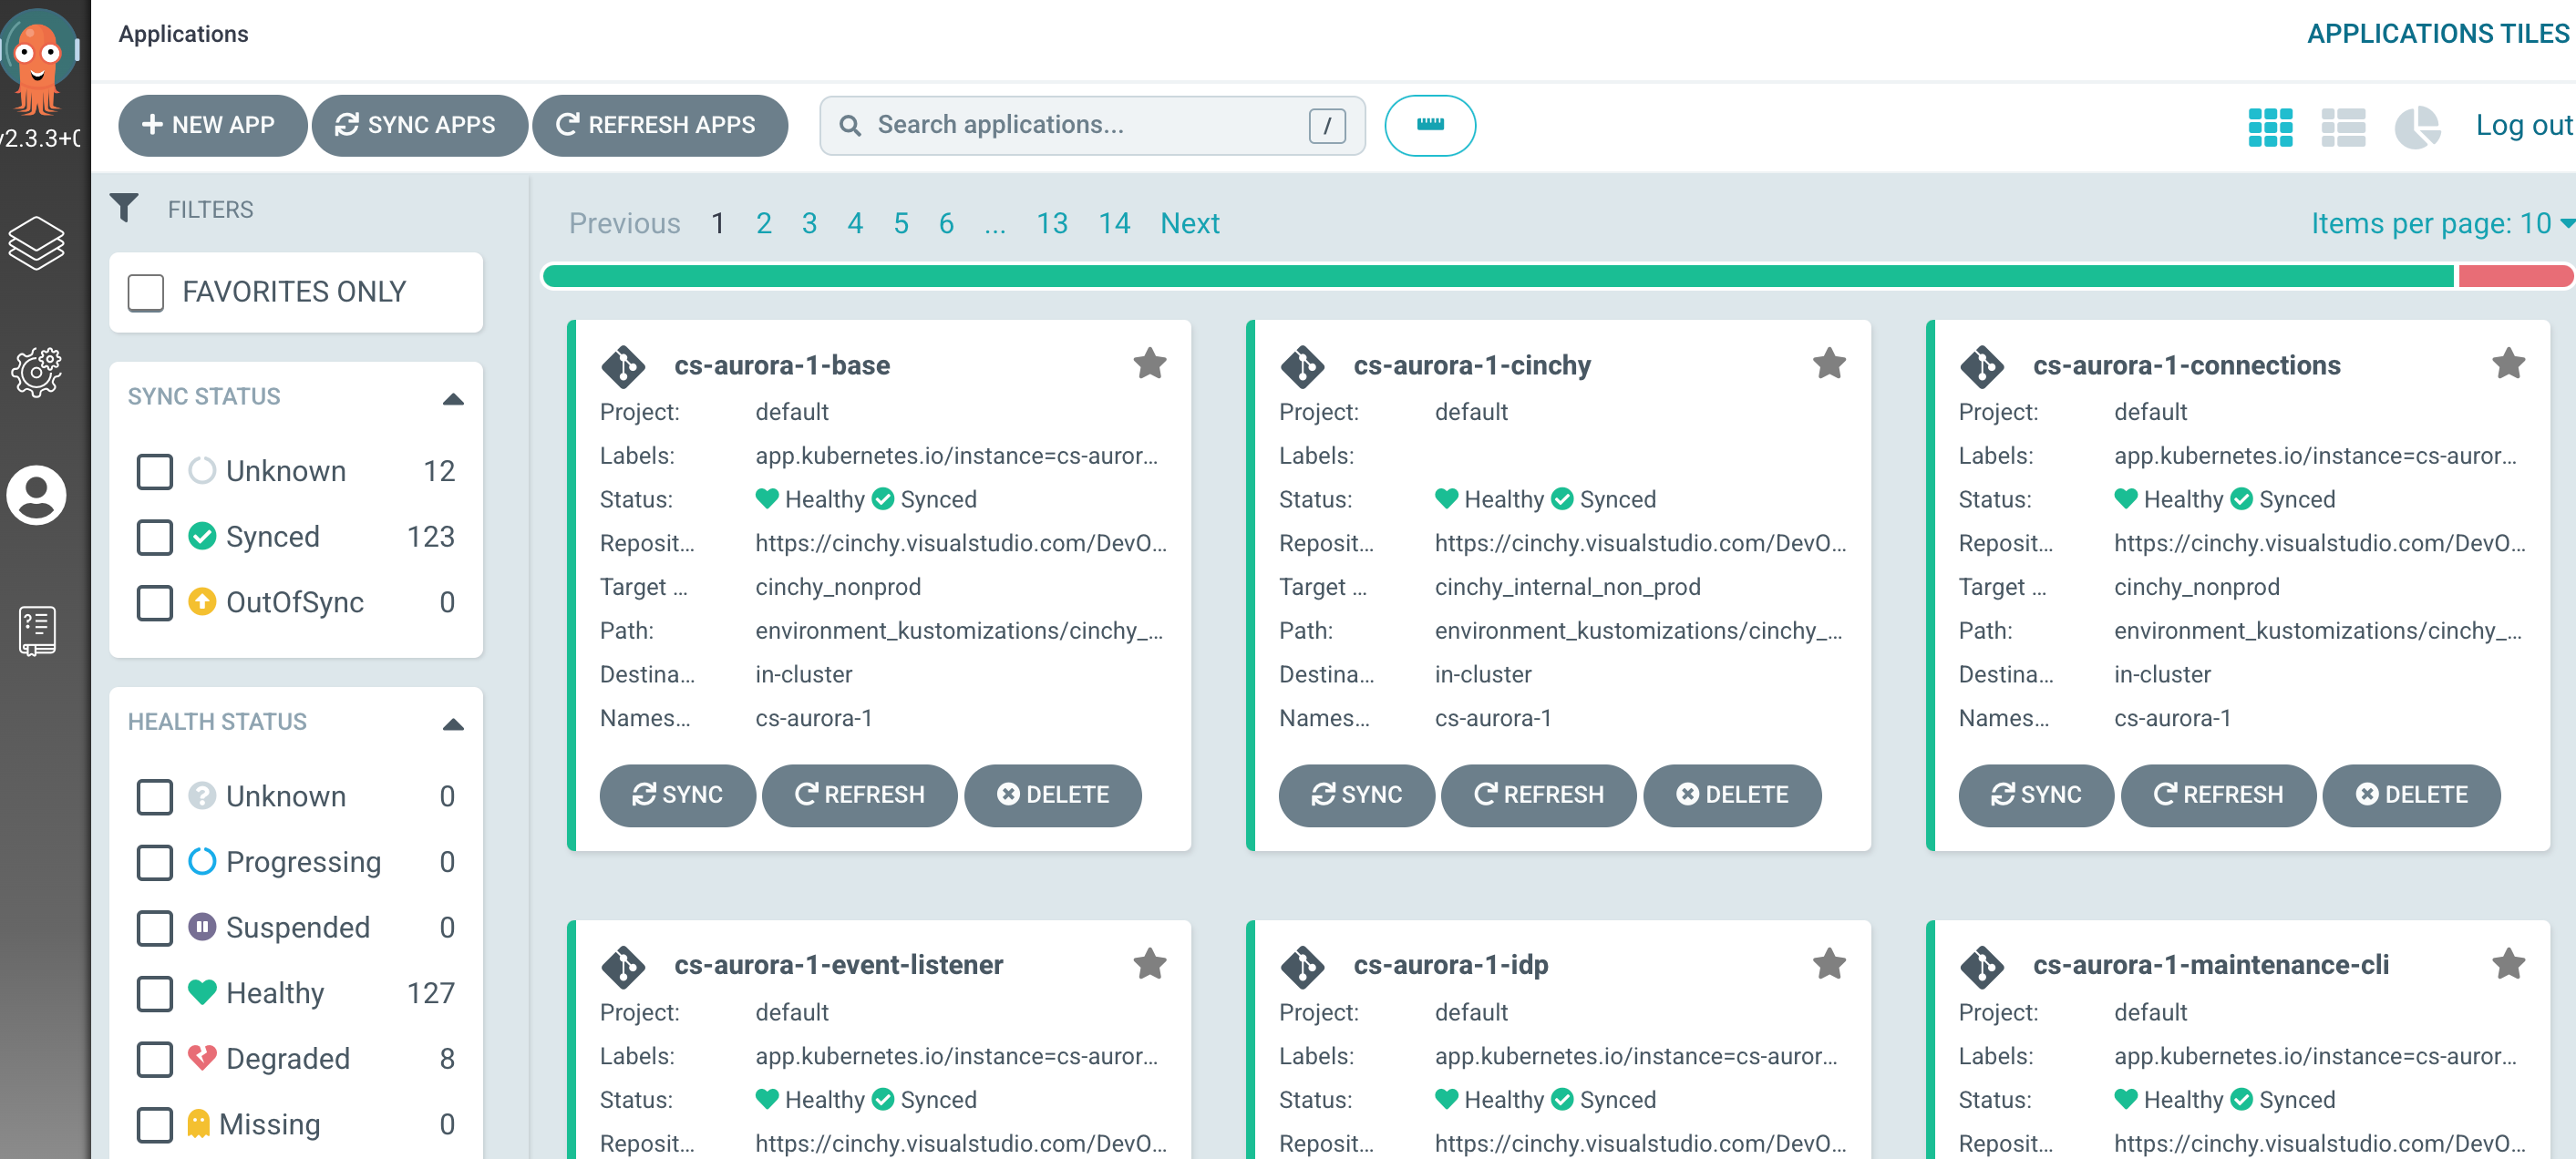
Application tiles view
The application tiles view is the default view when logging into ArgoCD. You can also access it through the grid widget in the upper right hand corner of the screen.
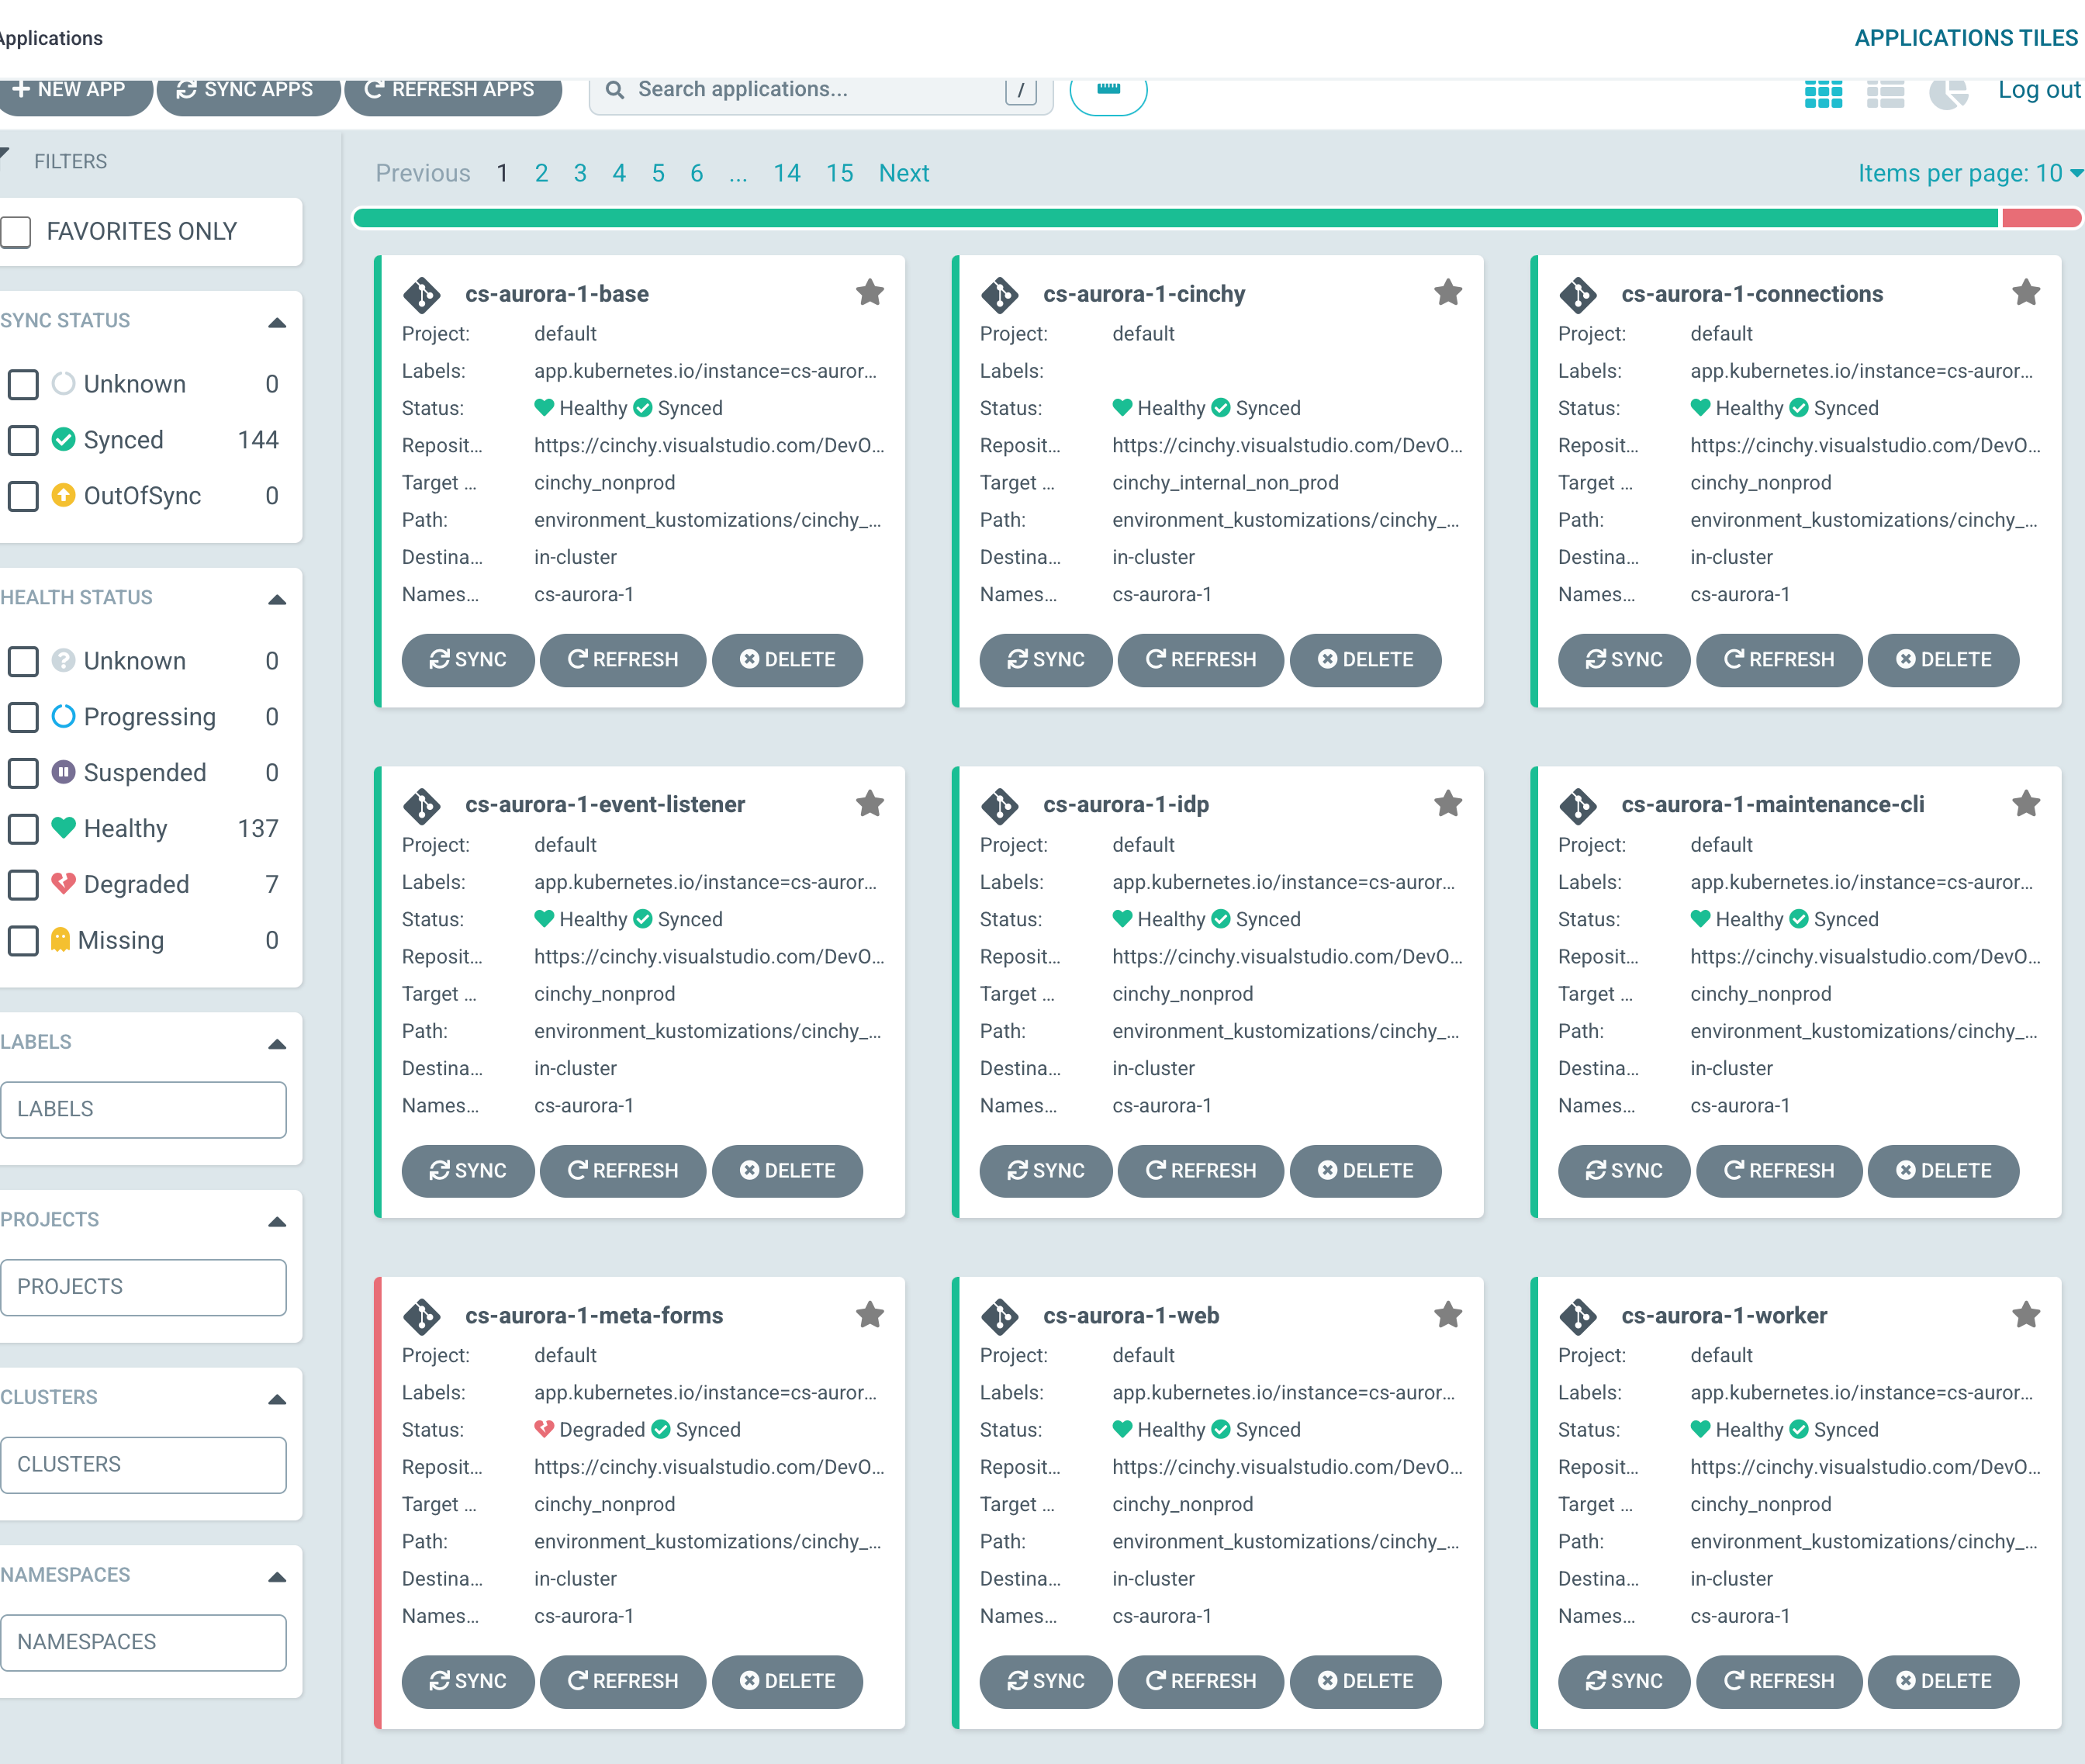
These application tiles each represent a pod in one of your Cinchy environments. By default, you should have an application tile for each of the following pods per namespace (Image 2):
- Base
- Connections
- Event Listener
- IDP
- Maintenance CLI
- Meta Forms
- Web
- Worker
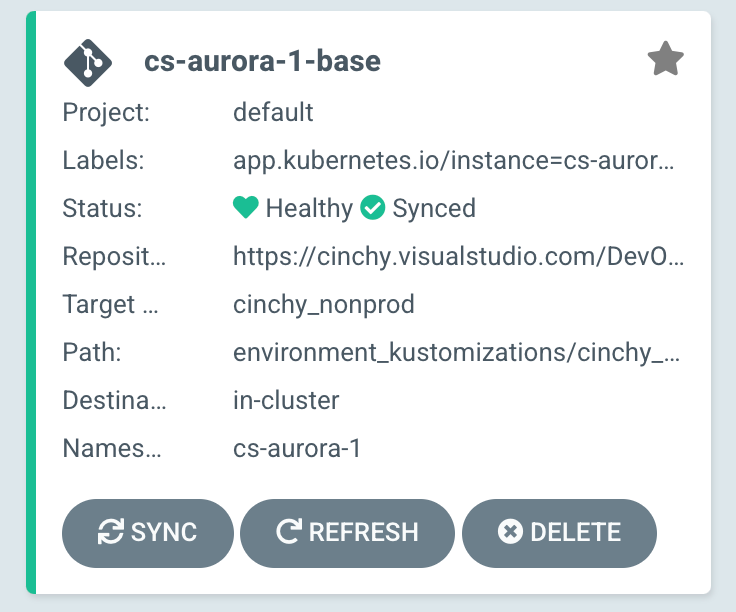
Each application tile shows you some important information about the pod, including its health and sync status. You can use the Sync, Refresh, and Delete buttons to manage your pods.
You can also click the star button on any application title to favourite the associated pod.
Pie chart view
The pie chart view (Image 3) shows an easy visualization of the health of your applications. Access this view by clicking on the pie chart widget located in the upper right hand corner of the screen.
Filtering
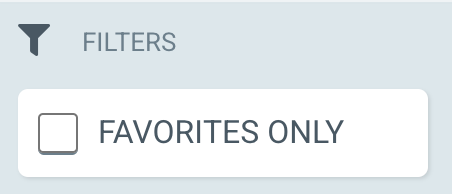
You can filter your view so that it only shows certain data. You can find the various filter options from the Filter column on the left hand side of any of the data views.
- Favorites Only: Filter by only favorite tiles (Image 4).
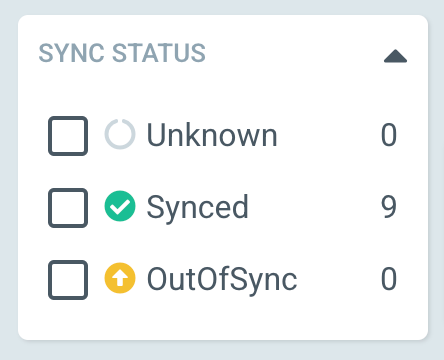
- Sync Status: You can easily view what's out of sync using this filter (Image 5).
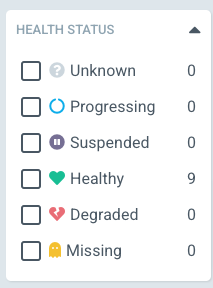
- Health Status: Check on the health of your applications by filtering using these parameters (Image 6).
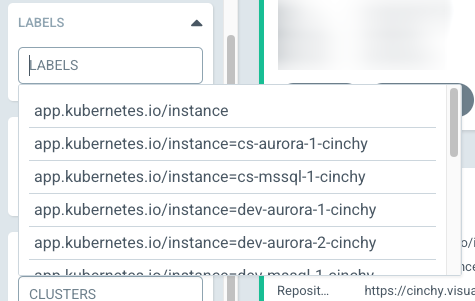
- Labels: Use these labels to filter by specific instances/environments (Image 7).
- Projects: If you choose to group your applications into projects, you can filter them using this tile (Image 8).

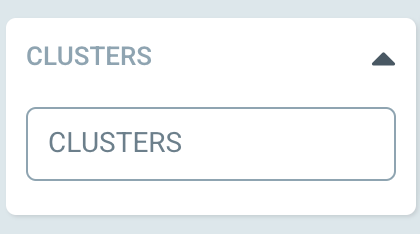
- Clusters: If you have more than one cluster, you can filter for it using the Clusters tile (Image 9).
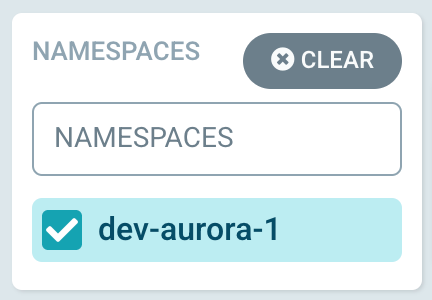
- Namespace: Lastly, you can filter by Namespace. The below example shows a filter based on the dev-aurora-1 namespace (Image 10).
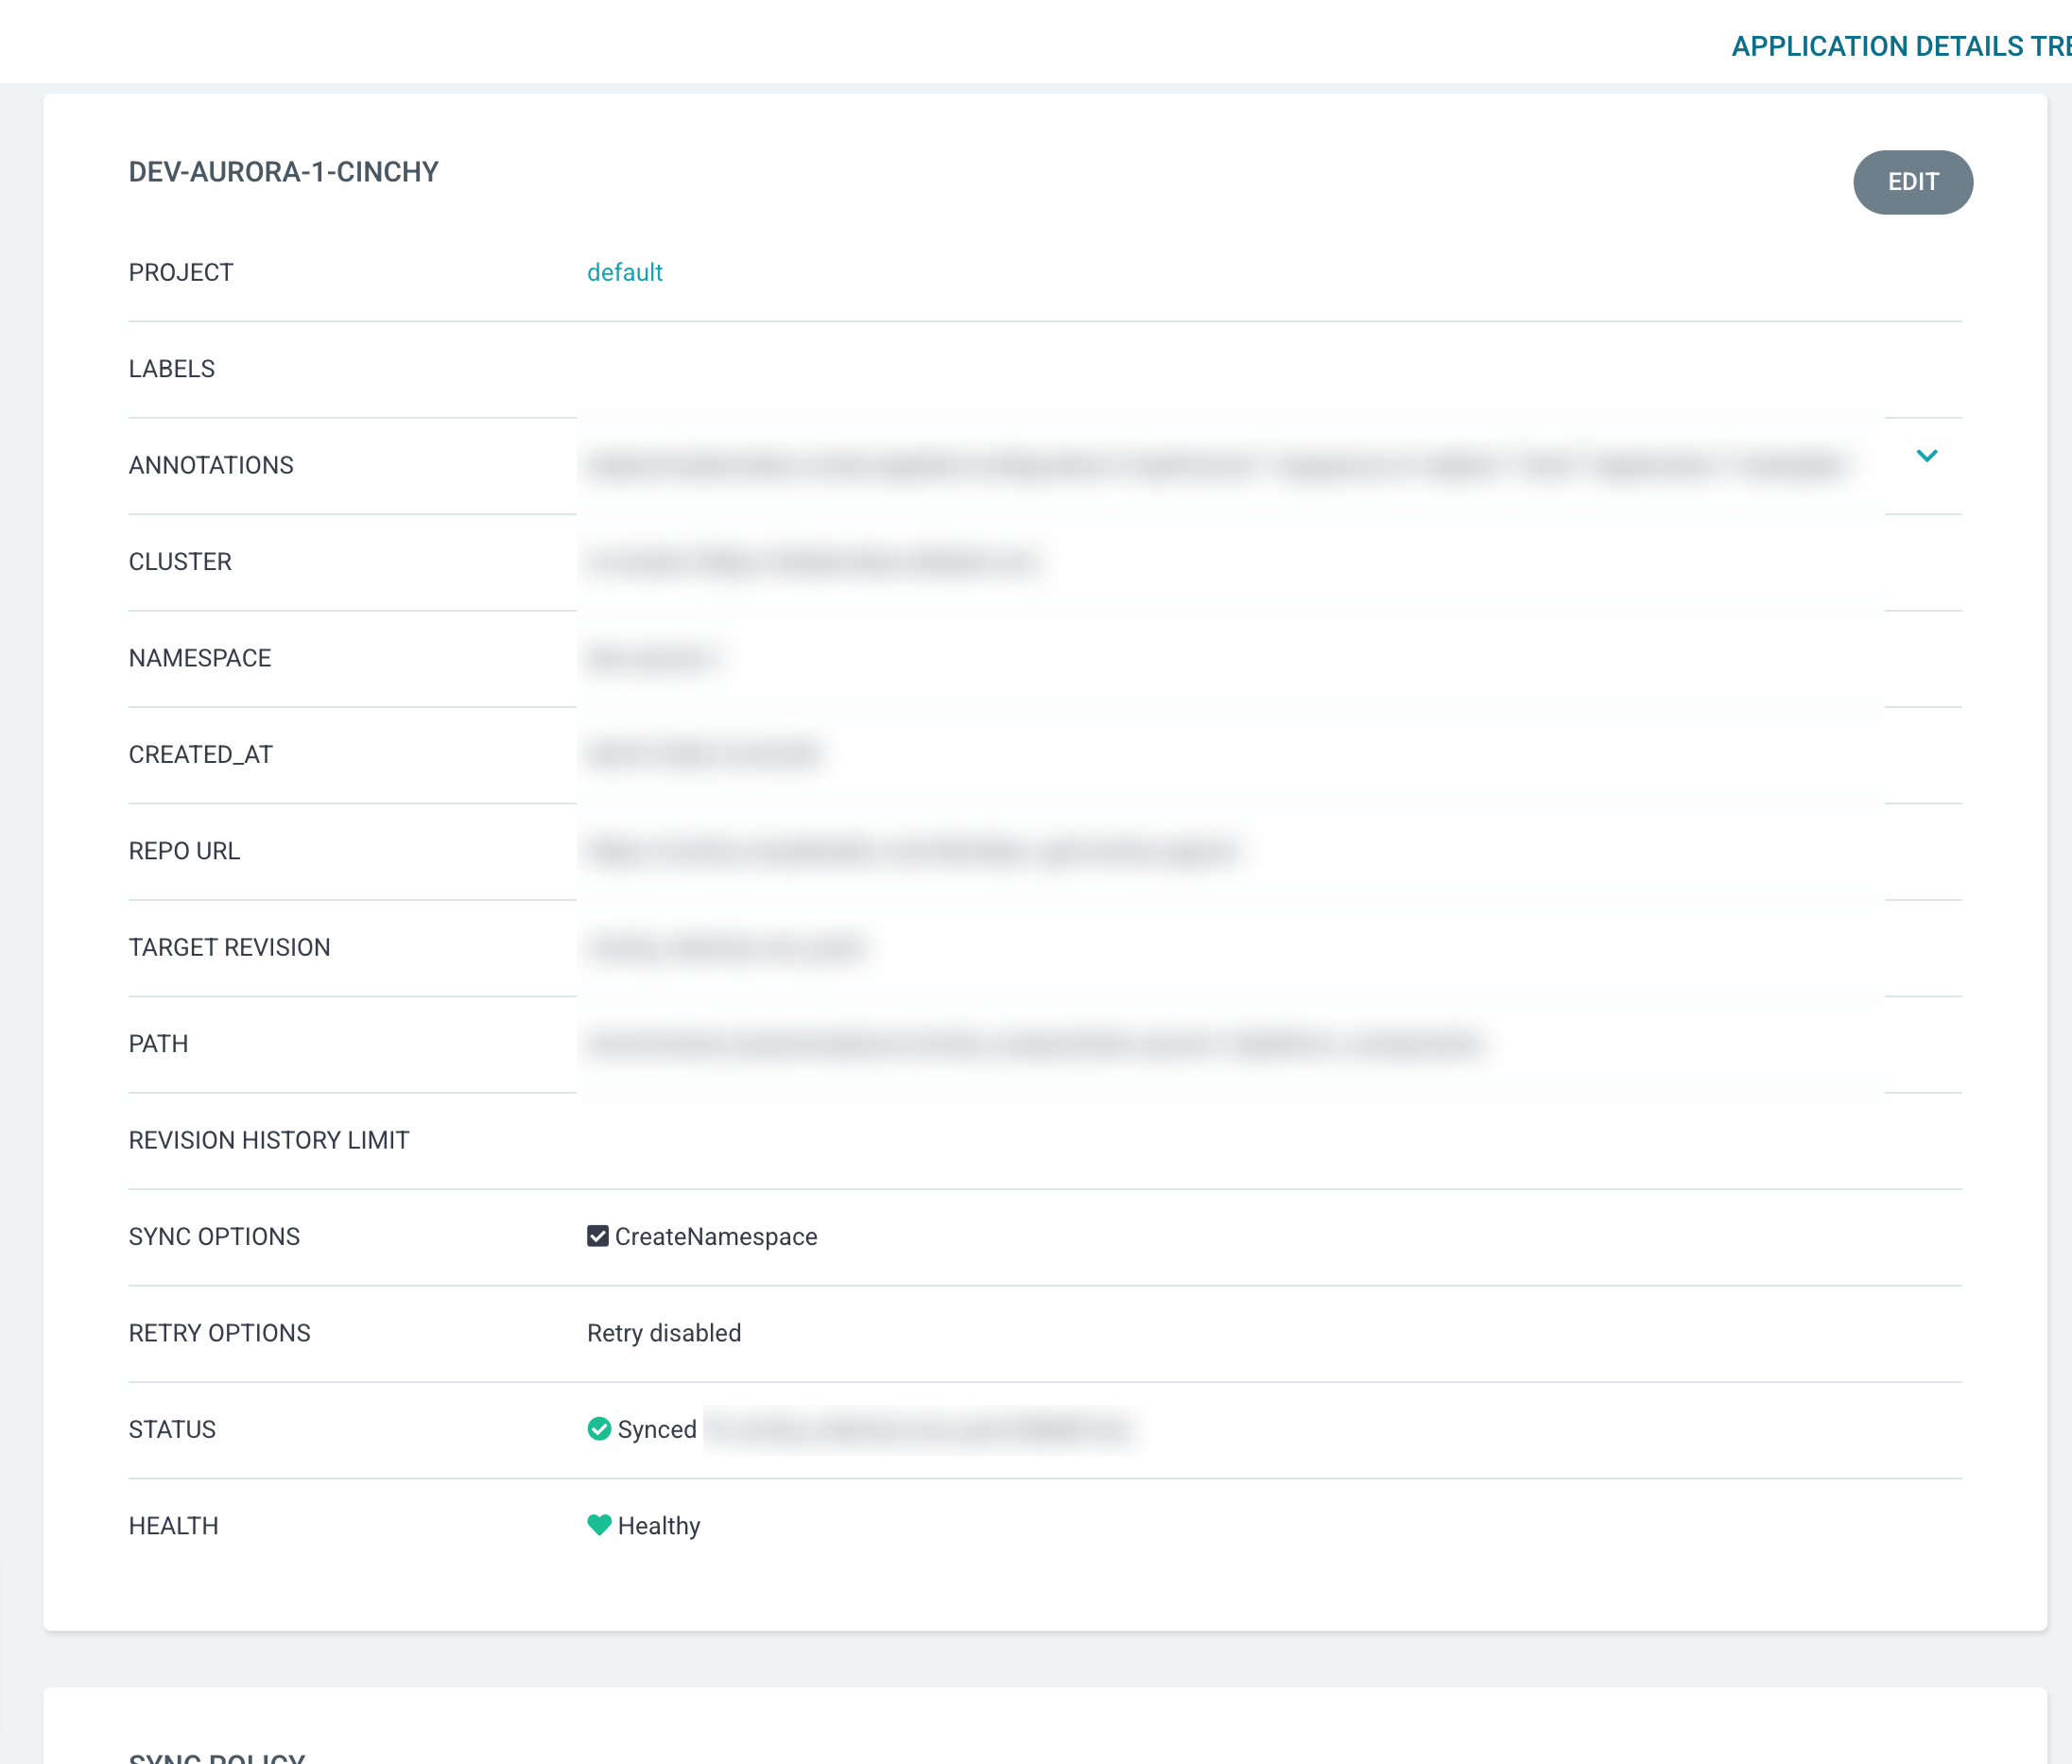
Detailed view
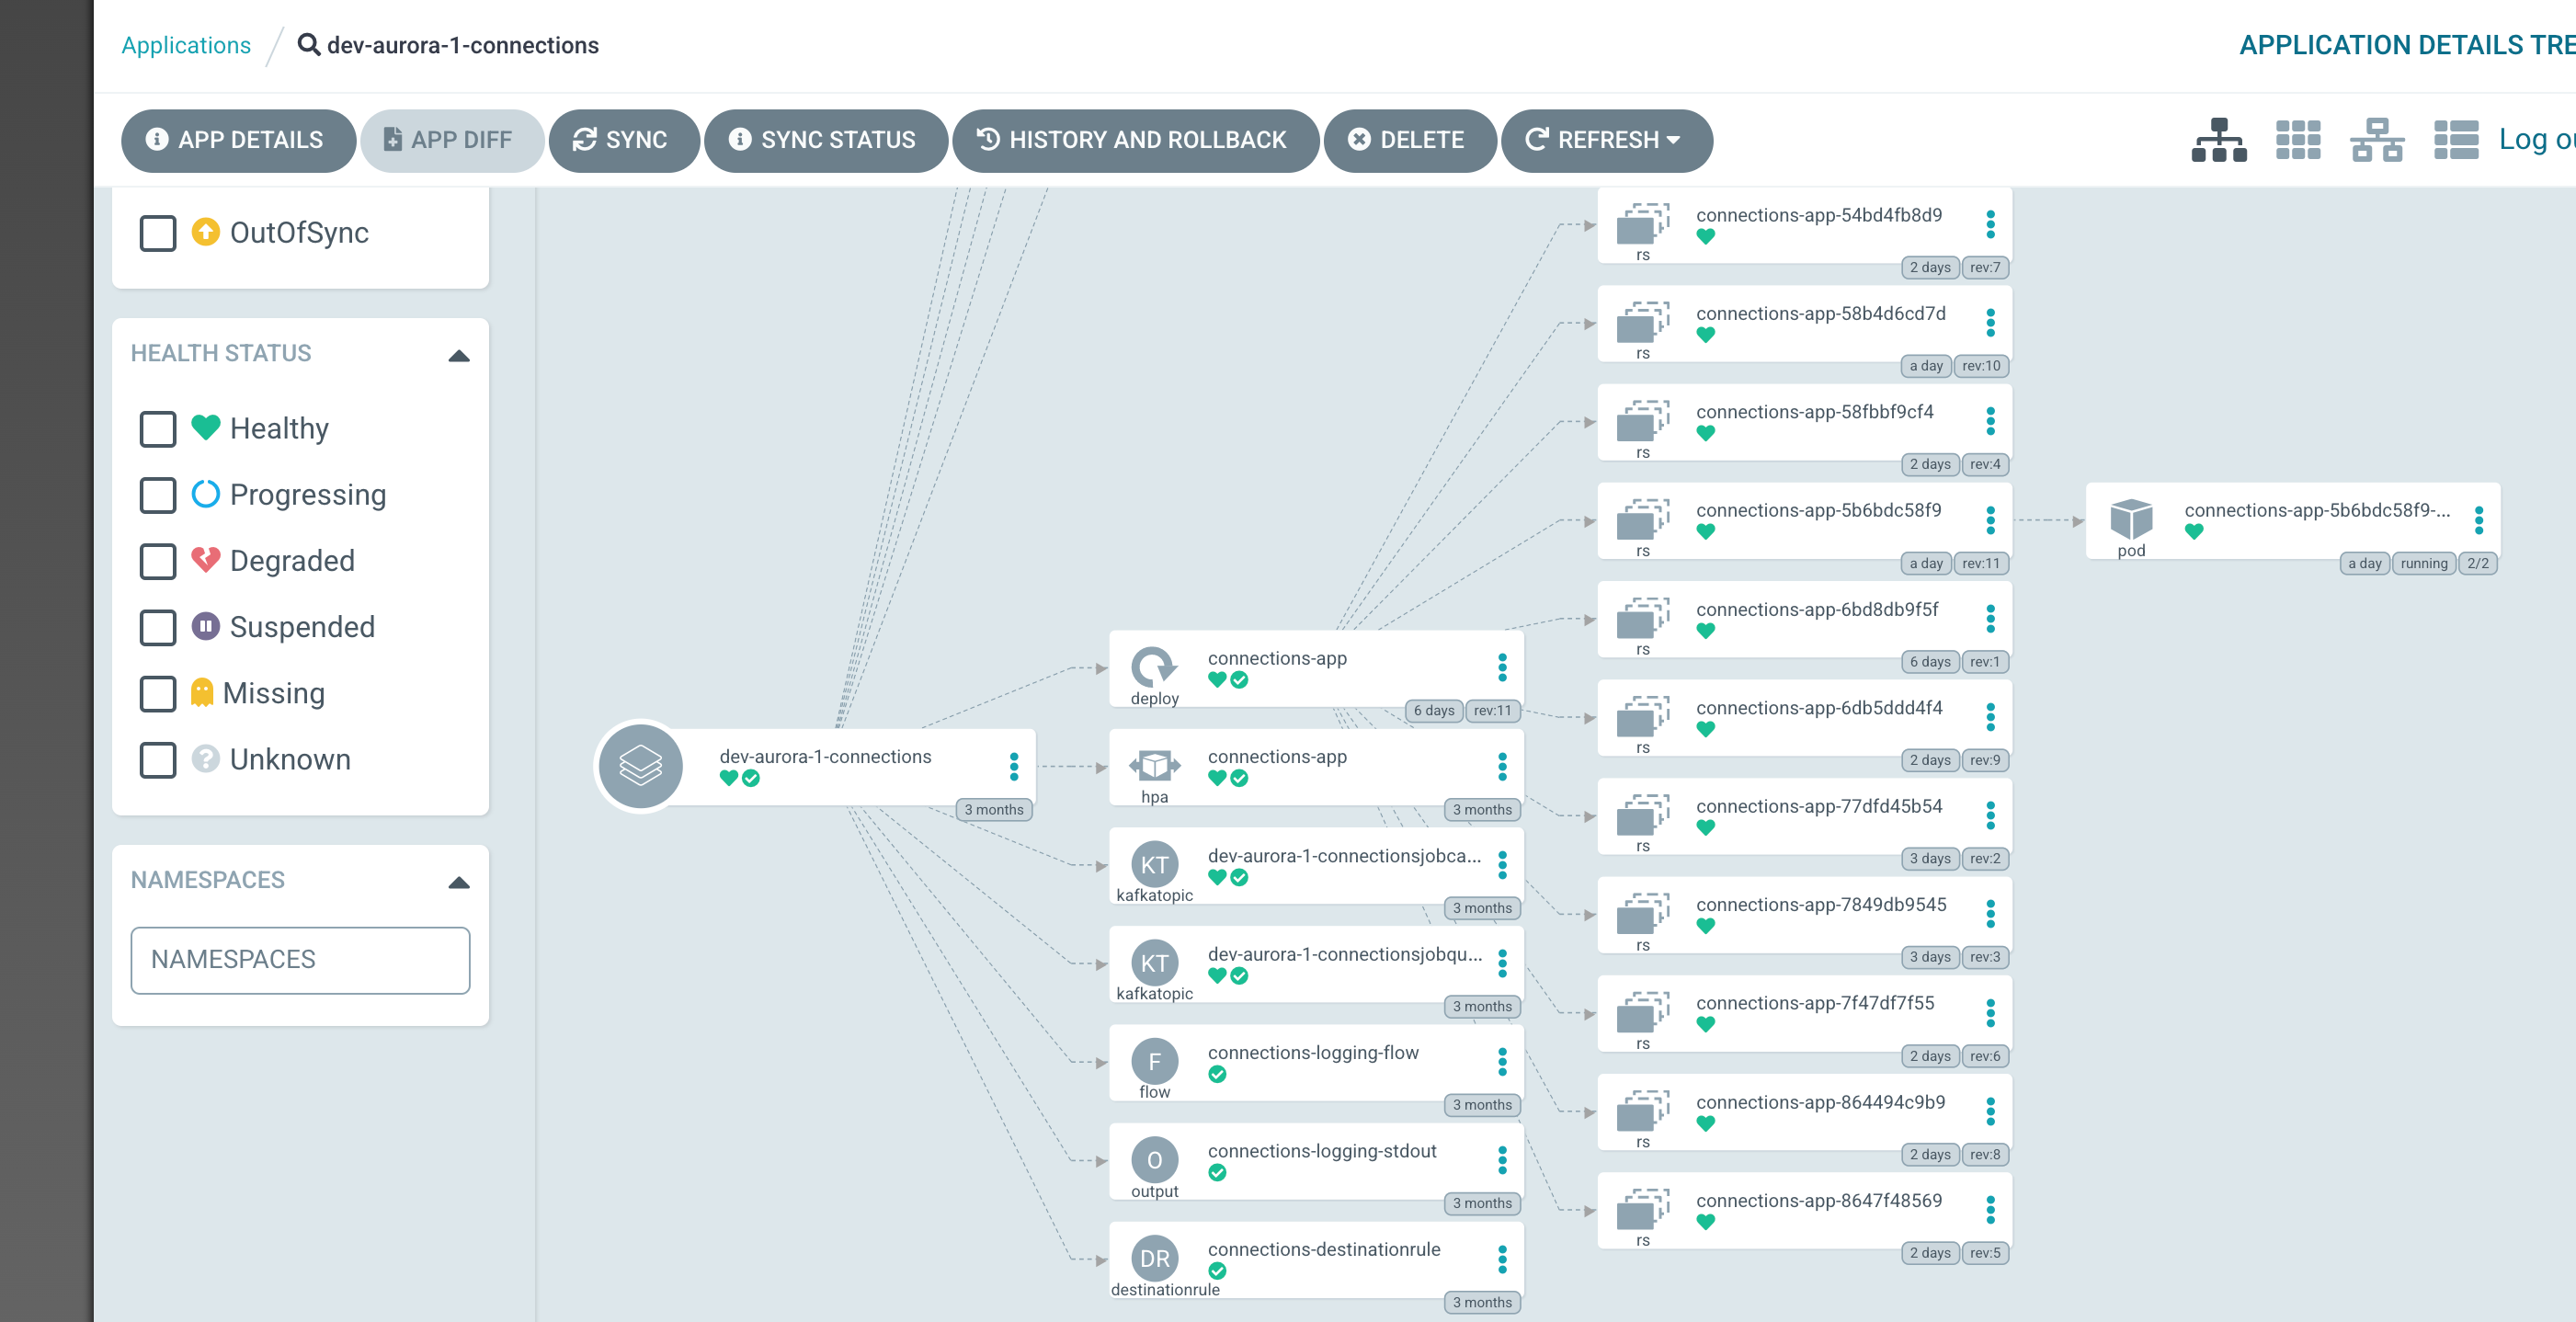
To bring up a more detailed view of your applications, click on the application tile. This view will show you all components, their health and their sync status (Image 11). You can use the top navigational buttons perform actions such as syncing, rolling back, or refreshing.
This view can be useful for load testing, since you can see each individual pod spinning up and down.
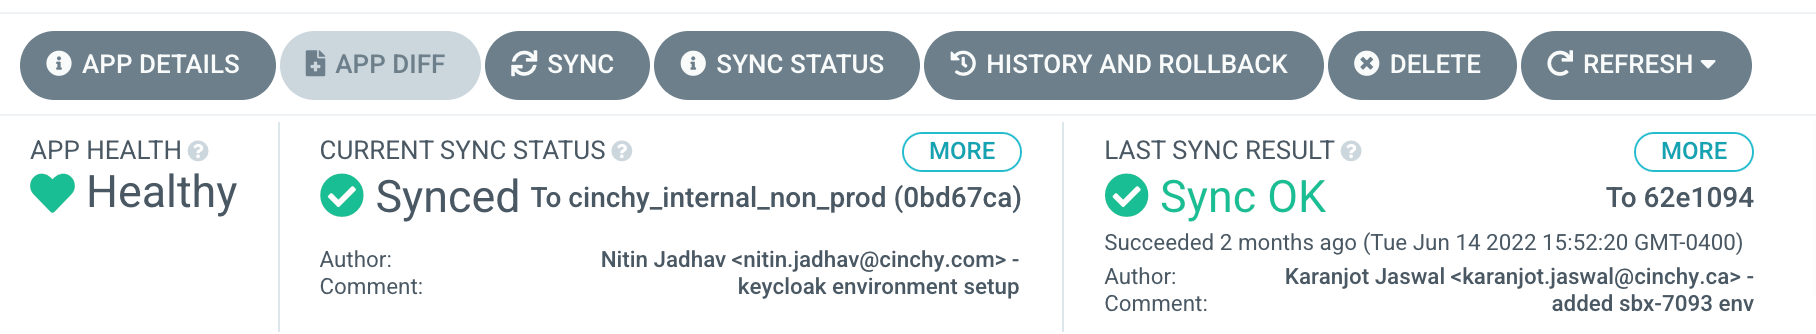
Health and sync status
View the status of your apps by looking at the health and sync status along the top of the page (Image 12).
Summary information
Clicking on any individual pod or component tile in this view will bring up its information, including a Summary, a list of Events, your Manifest, and Parameters (Image 13).
You can also use this screen to edit or delete applications.
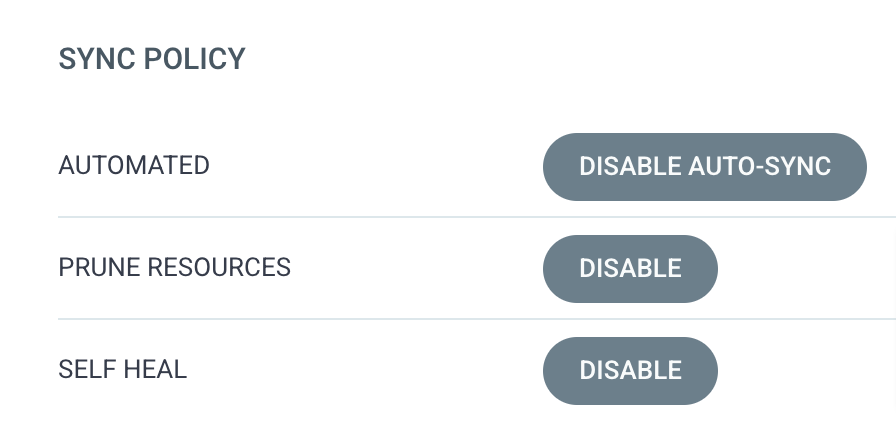
Sync policies
From the detailed tile summary you can also set your sync policies, such as automation, resource pruning, and self healing (Image 14).
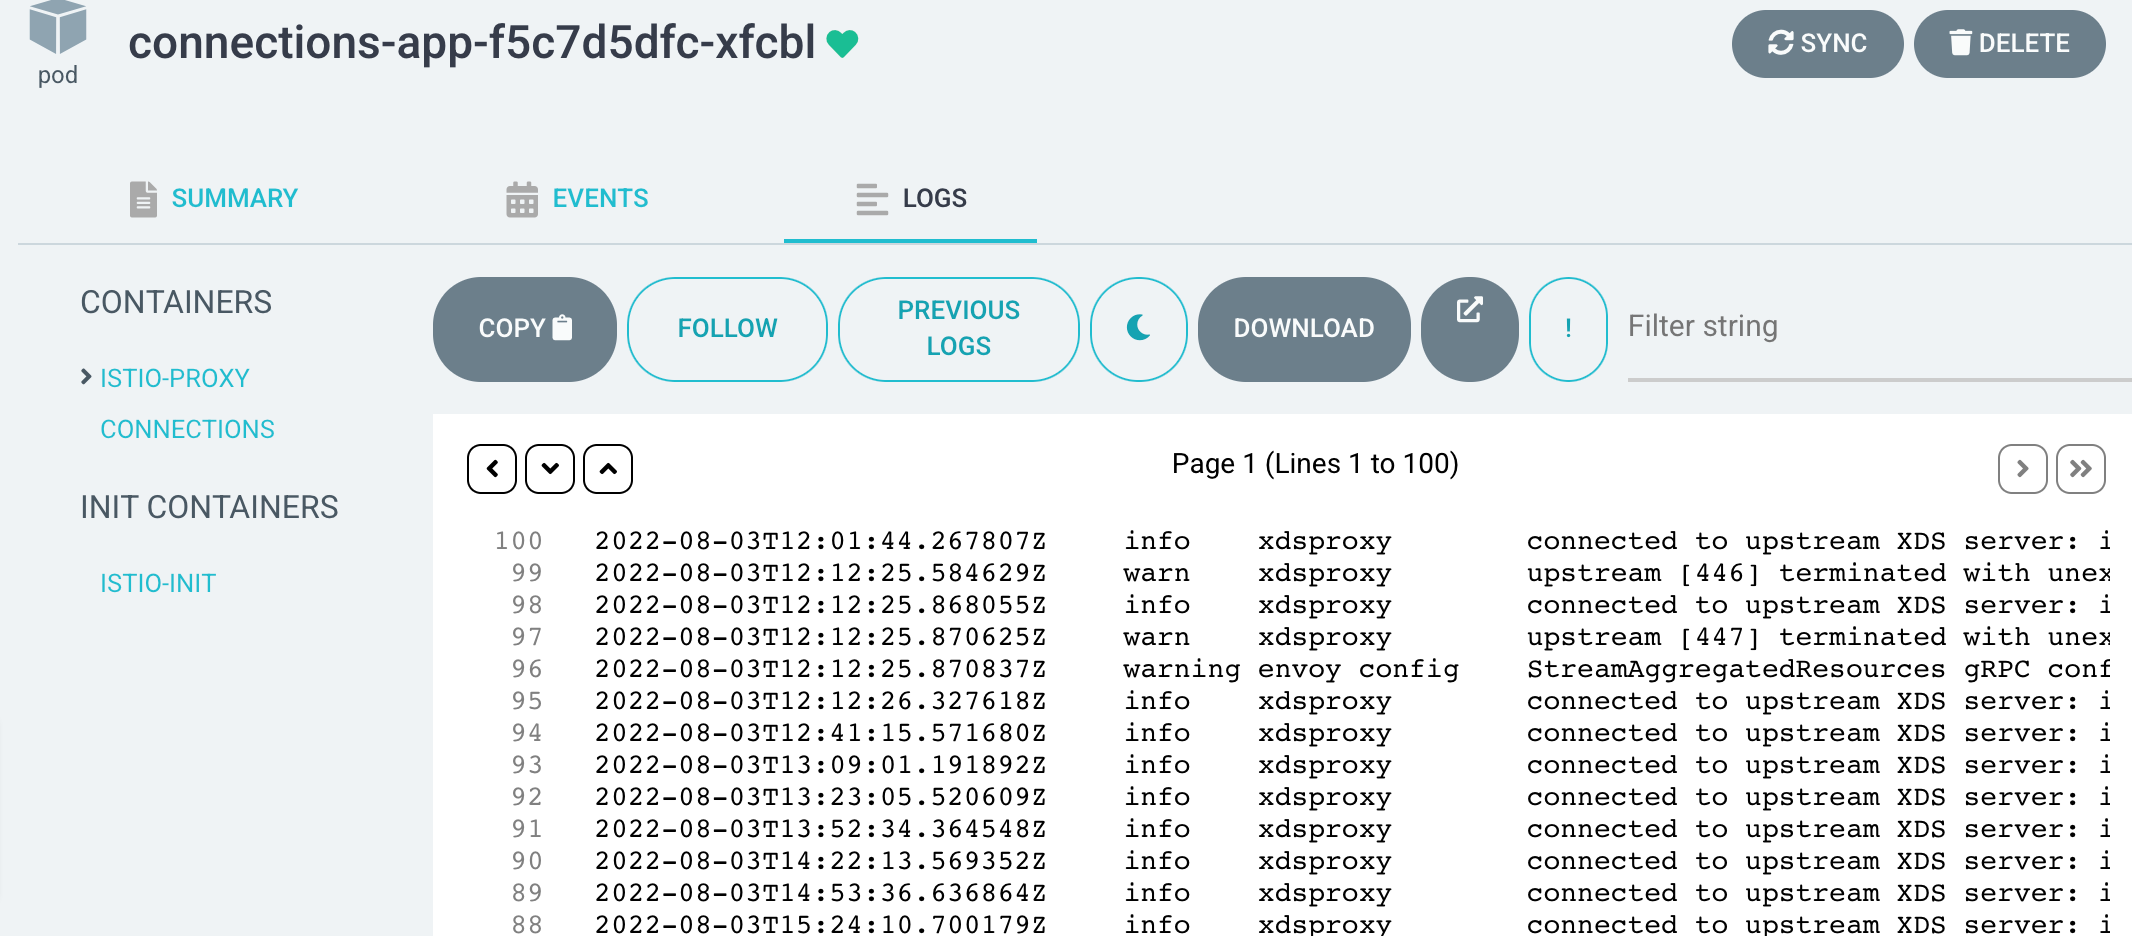
Logs
You can click on the Logs tab in your detailed summary page to view the applicable logs for your selected pod (Image 15). You can filter, follow, snooze, copy, or download any logs.