Set up alerts
Monitoring and alerting
OpenSearch comes with the ability to set up alerts based on any number of monitors. You can then push these alerts via email, should you desire.
Before you set up a monitor or alert, ensure that you have added your data source as an index pattern.
Definitions:
| Monitor | A job that runs on a defined schedule and queries OpenSearch indices. The results of these queries are then used as input for one or more triggers. |
|---|---|
| Trigger | Conditions that, if met, generate alerts. |
| Alert | An event associated with a trigger. When an alert is created, the trigger performs actions, which can include sending a notification. |
| Action | The information that you want the monitor to send out after being triggered. Actions have a destination, a message subject, and a message body. |
| Destination | A reusable location for an action. Supported locations are Amazon Chime, Email, Slack, or custom webhook. |
Create your destination
Your destination will be where you want your alerts to be pushed to. OpenSearch supports various options, but this guide focuses on email.
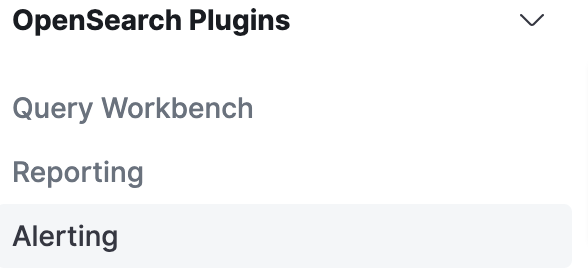
- From the left navigation pane, click Alerting (Image 1).
-
Click on the Destinations Tab > Add Destination
-
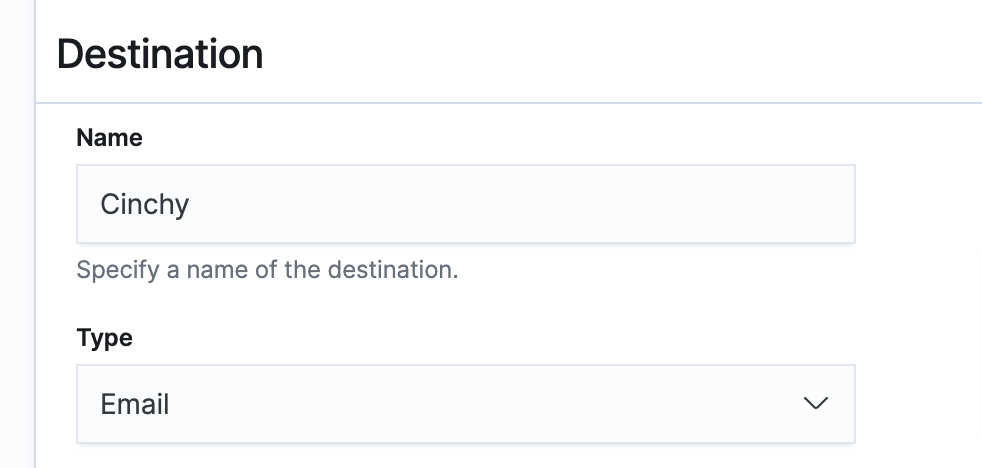
Add a name to label your destination and select Email as type (Image 2)
- You will need to assign a Sender. This is the email address that the alert will send from when you specify this specific destination. To add a new Sender, click Manage Senders (Image 3).

-
Click Add Sender
-
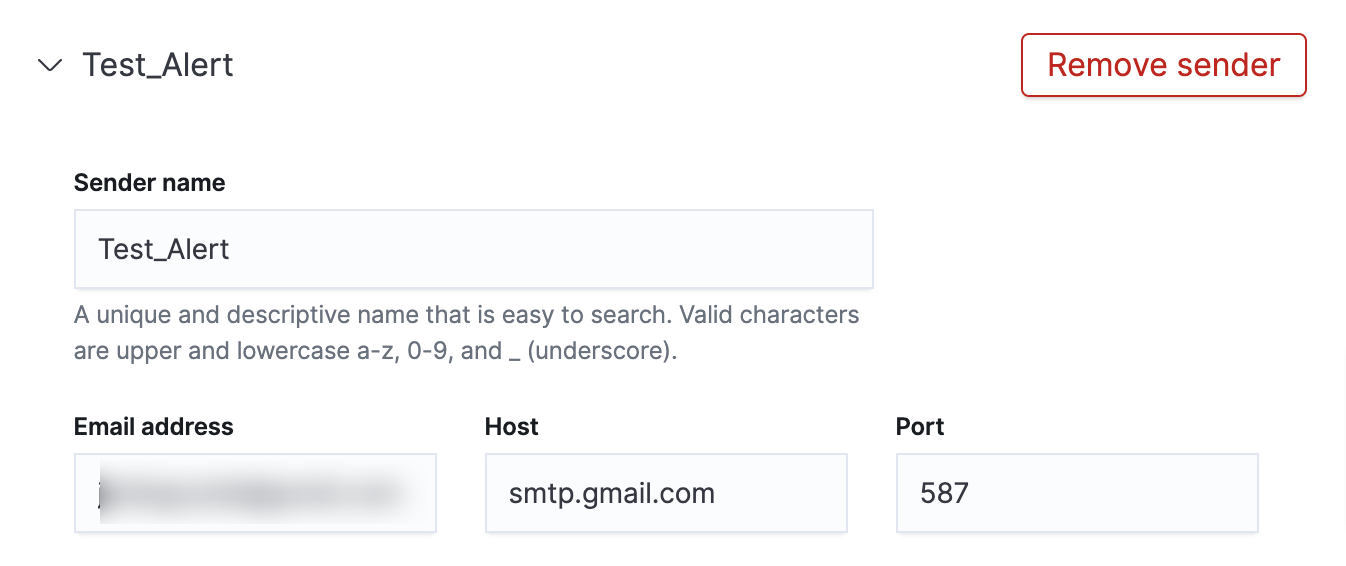
Add in the following information (Image 4):
- Sender Name
- Email Address
- Host (this is the host address for the email provider)
- Port (this is the Port of the email provider)
- Encryption
Ensure that you authenticate the Sender, or your alert won't work.
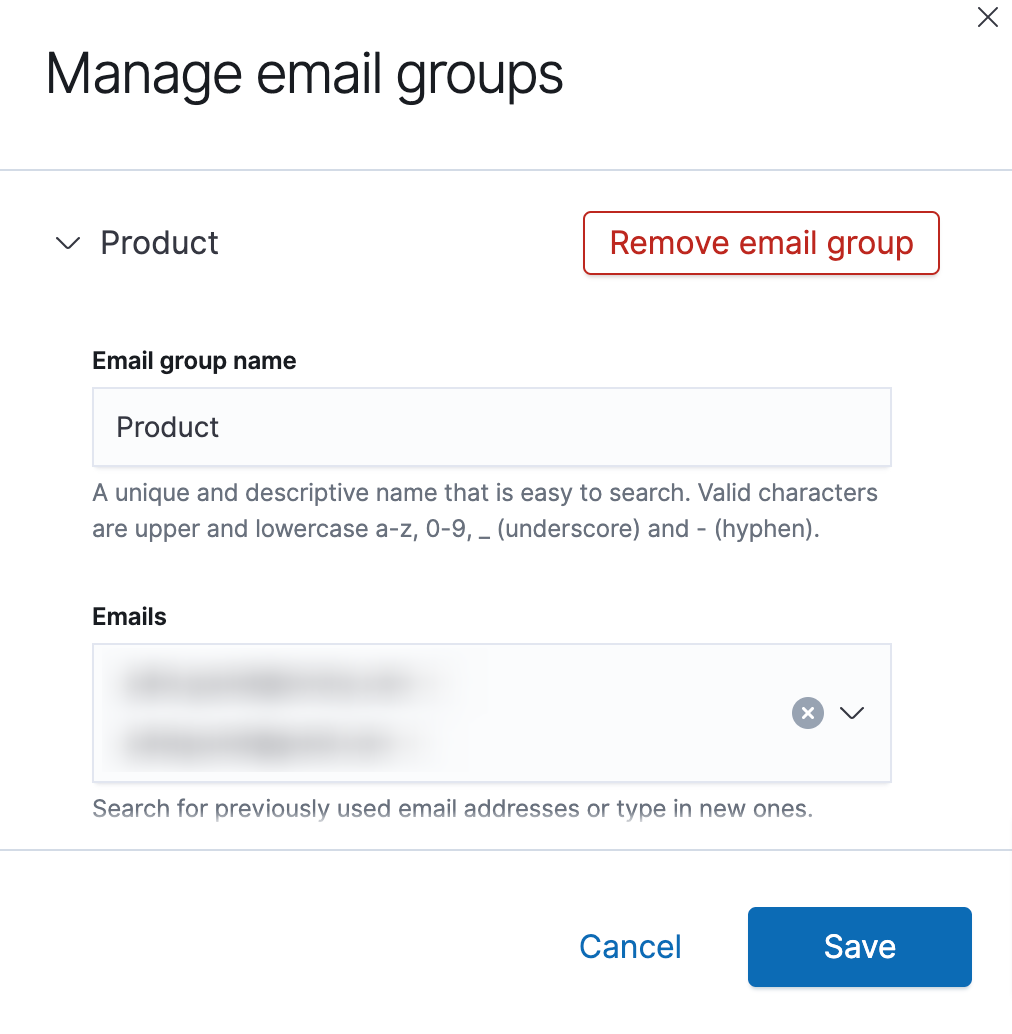
- You will need to assign your Recipients. This is the email address(es) that will receive the alert when you specify this specific destination. To add a new Recipient, you can either type their email(s) into the box, or click Manage Senders to create an email group (Image 5).
- Click Update to finish your Destination.
Authenticate your sender
You will need to authenticate your sender for emails to come through. Please contact Cinchy Customer Support to help you with this step.
- Via email: support@cinchy.com
- Via phone: 1-888-792-6051
- Through the support portal: Support Portal
Create your monitor
Your monitor is a job that runs on a defined schedule and queries OpenSearch indices. The results of these queries are then used as input for one or more triggers.
- From the Alerting dashboard, select Monitors > Create Monitor (Image 6).

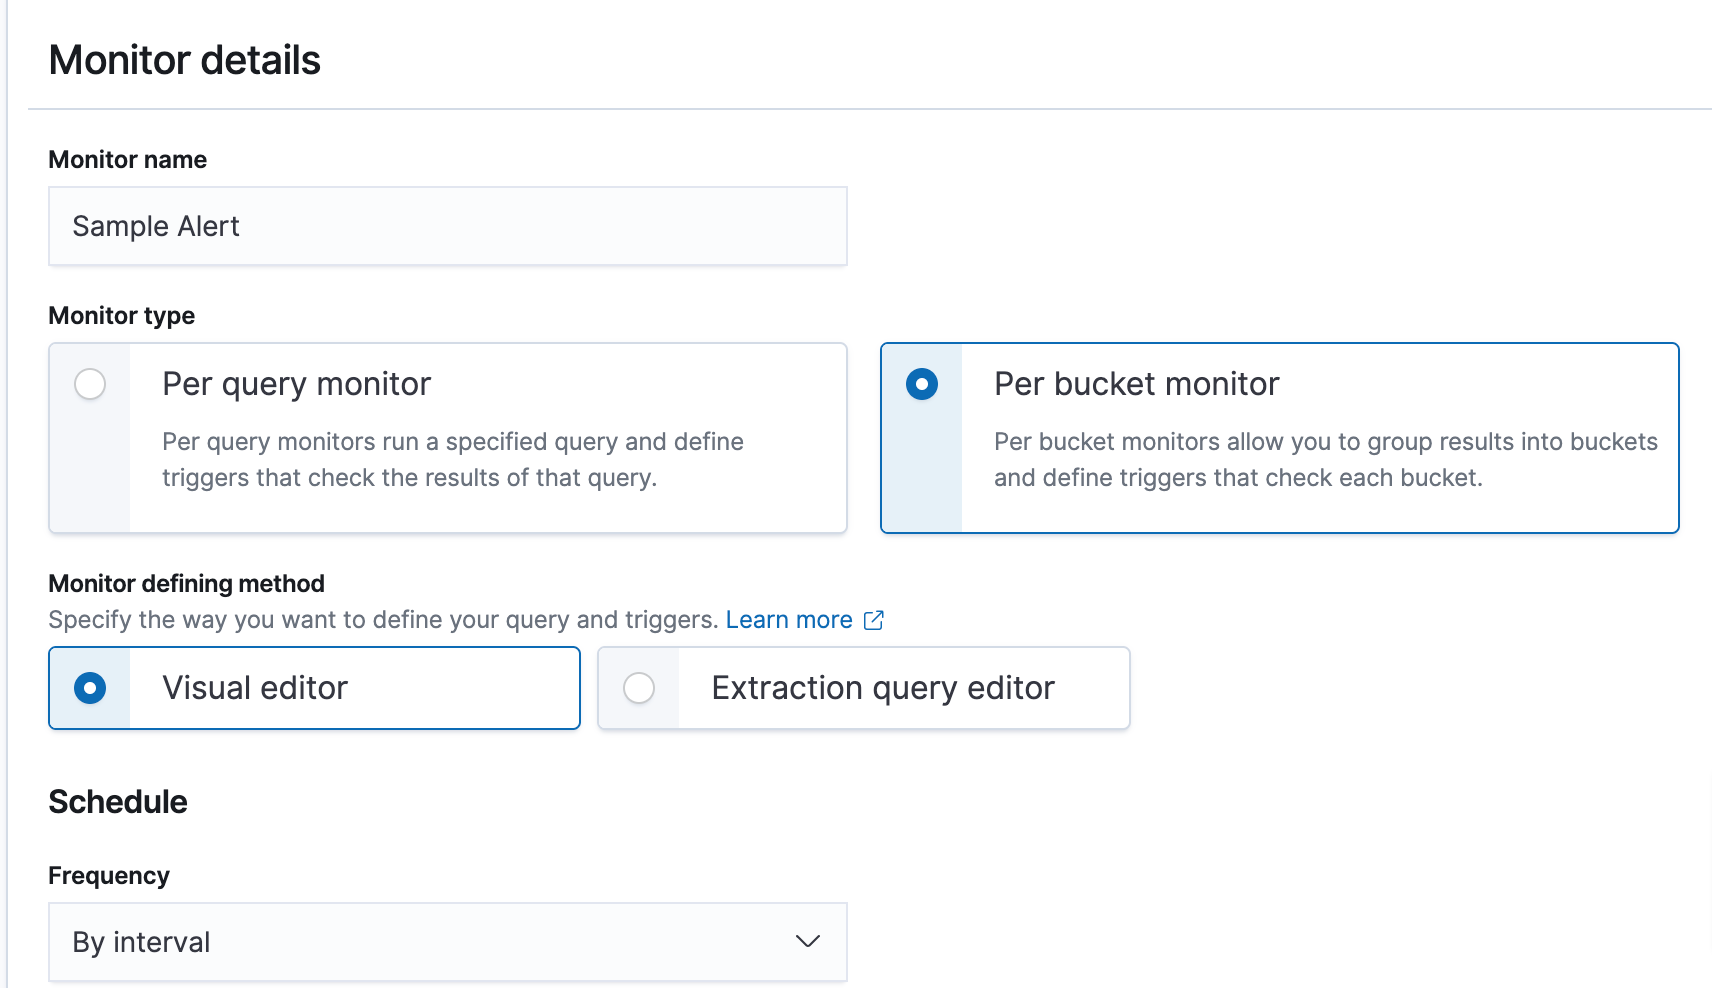
- Under Monitor Details, add in the following information (Image 7).
- Monitor Name
- Monitor Type (This example uses Per Bucket)
- Whereas query-level monitors run your specified query and then check whether the query’s results triggers any alerts, bucket-level monitors let you select fields to create buckets and categorize your results into those buckets.
- The alerting plugin runs each bucket’s unique results against a script you define later, so you have finer control over which results should trigger alerts. Each of those buckets can trigger an alert, but query-level monitors can only trigger one alert at a time.
- Monitor Defining Method: the way you want to define your query and triggers. (This example uses Visual Editor)
- Visual definition works well for monitors that you can define as “some value is above or below some threshold for some amount of time.”
- Query definition gives you flexibility in terms of what you query for (using the OpenSearch query DSL) and how you evaluate the results of that query (Painless scripting).
- Schedule: Choose a frequency and time zone for your monitor.
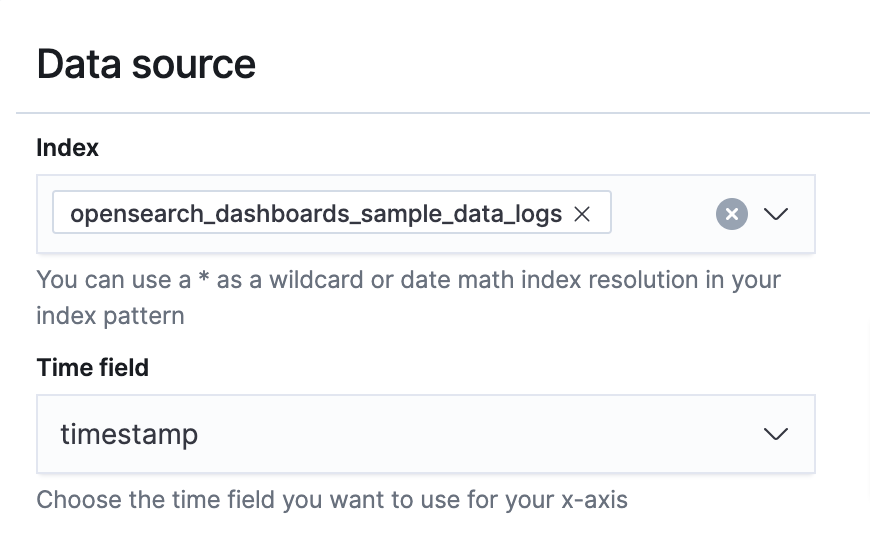
- Under Data Source add in the following information (Image 8):
- Index: Define the index you want to use as a source for this monitor
- Time Field: Select the time field that will be used for the x-axis of your monitor
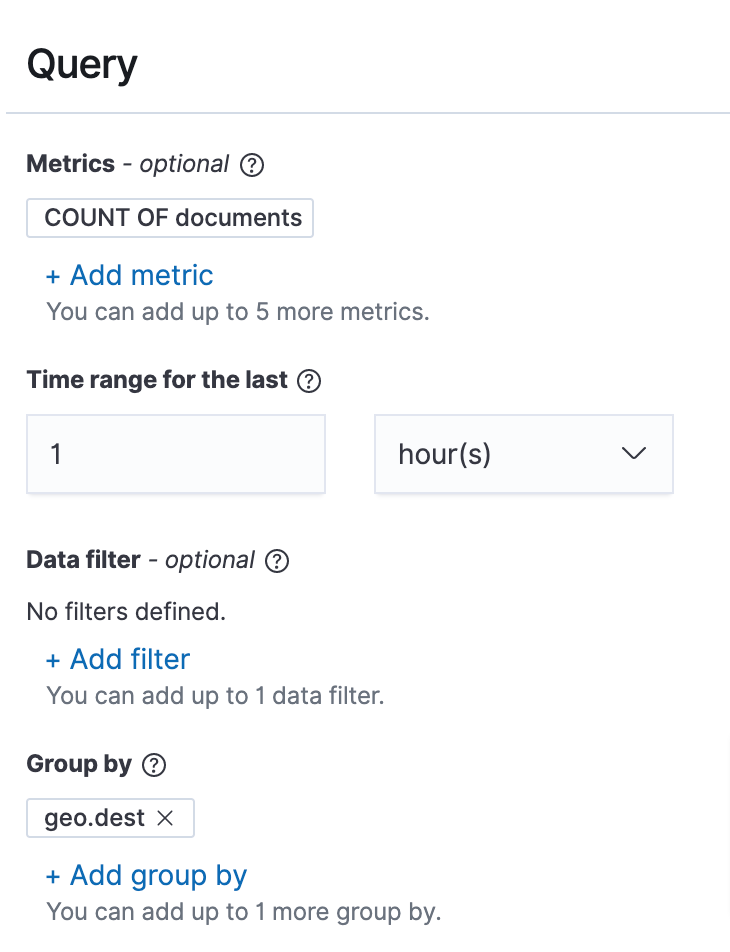
- The Query section will appear differently depending on the Monitor Defining Method selected in step 2 (Image 9). This example is using the visual editor.
To define a monitor visually, select an aggregation (for example, count() or average()), a data filter if you want to monitor a subset of your source index, and a group-by field if you want to include an aggregation field in your query. At least one group-by field is required if you’re defining a bucket-level monitor. Visual definition works well for most monitors.
Add a trigger
A trigger is a condition that, if met, will generate an alert.
- To add a trigger, click the Add a Trigger button (Image 10).

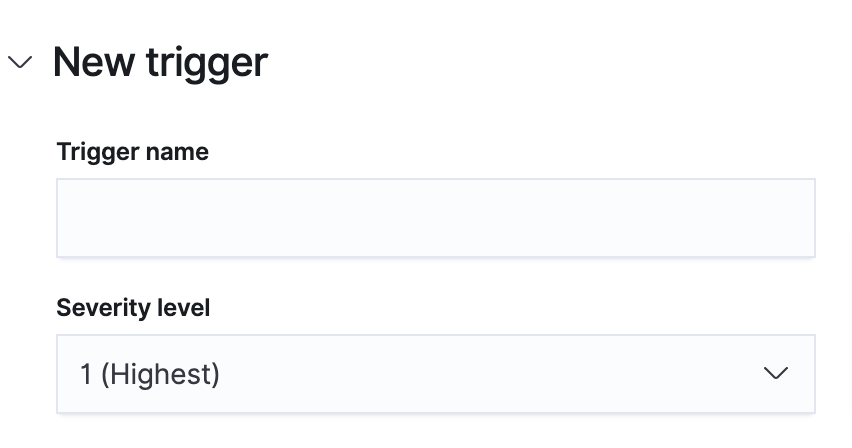
- Under New Trigger, define your trigger name and severity level (with 1 being the highest) (Image 11).
- Under Trigger Conditions, you will specify the thresholds for the query metrics you set up previously (Image 12). In the below example, our trigger will be met if our COUNT threshold goes ABOVE 10000.
You can also use keyword filters to drill down into a more specific subset of data from your data source.

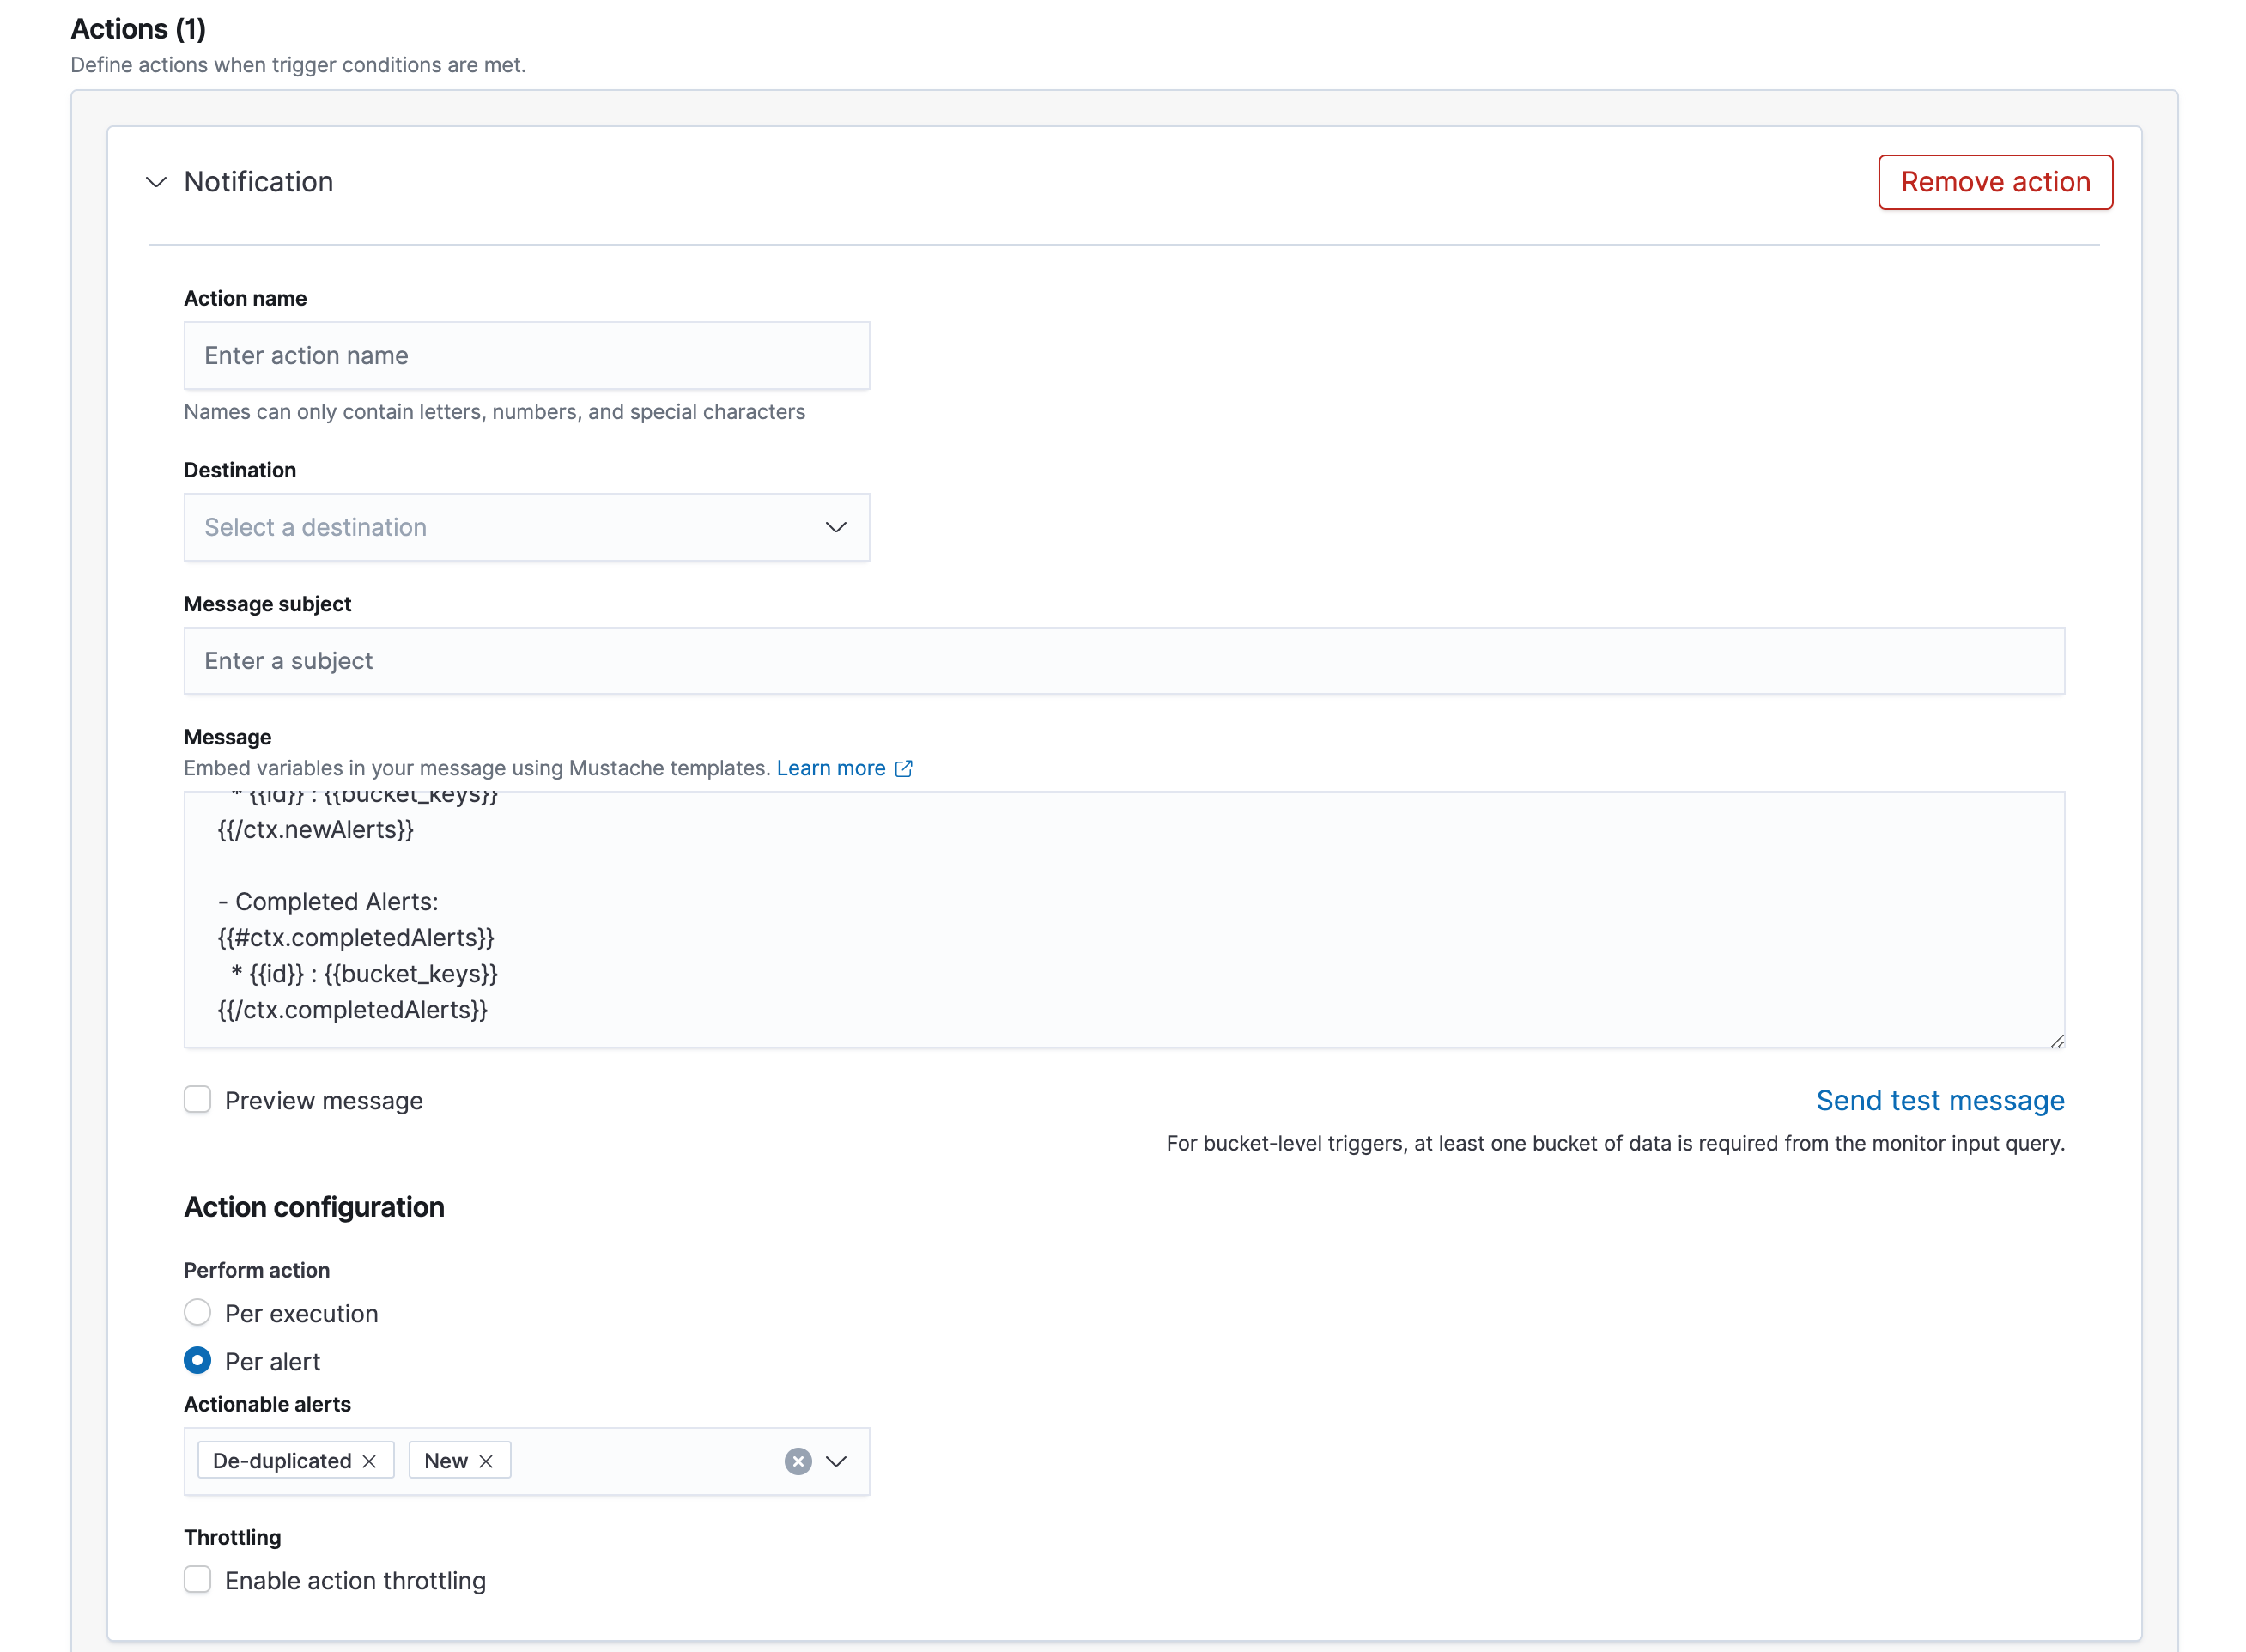
- In the Action section you will define what happens if the trigger condition is met (Image 13). Enter the following information to set up your Action:
- Action Name
- Destination
- Message Subject: In the case of an email alert, this will be the email subject line.
- Message: In the case of an email alert, this will be the email body.
- Perform Action: If you’re using a bucket-level monitor, decide whether the action is performed per execution or per alert.
- Throttling: Enable action throttling if you wish. Use action throttling to limit the number of notifications you receive within a given span of time.
-
Click Send Test Message, if you want to test that the alert functions correctly.
-
Click Save.
Example alerts
Alerting on Stream Errors
This example pushes an alert based on errors. We will monitor our Connections stream for any instance of 'error', and push out an alert when our trigger threshold is hit.
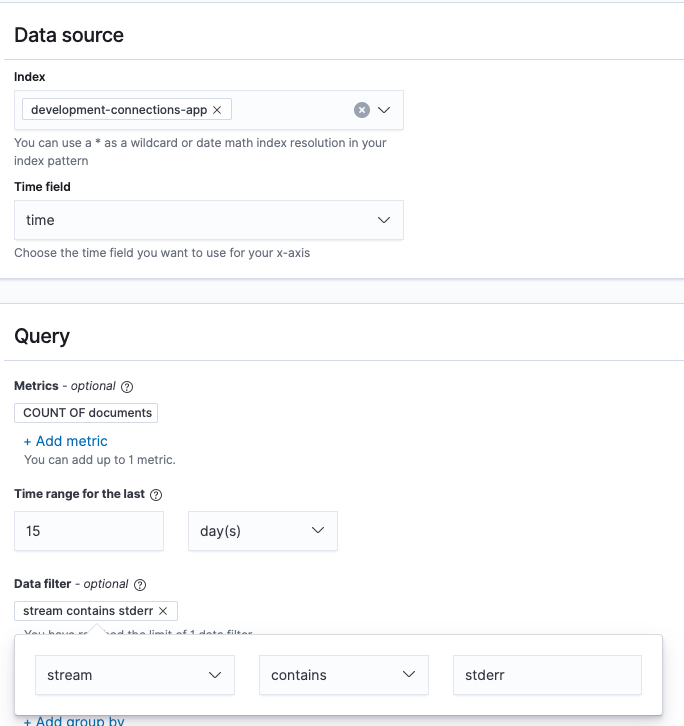
- First we create our Monitor by defining the following (Image 14):
- Index: This example looks at Connections.
- Time Field
- Time Range: Define how far back you want to monitor
- Data Filter: We want to monitor specifically whenever the Stream field of our index is stderr (standard error).
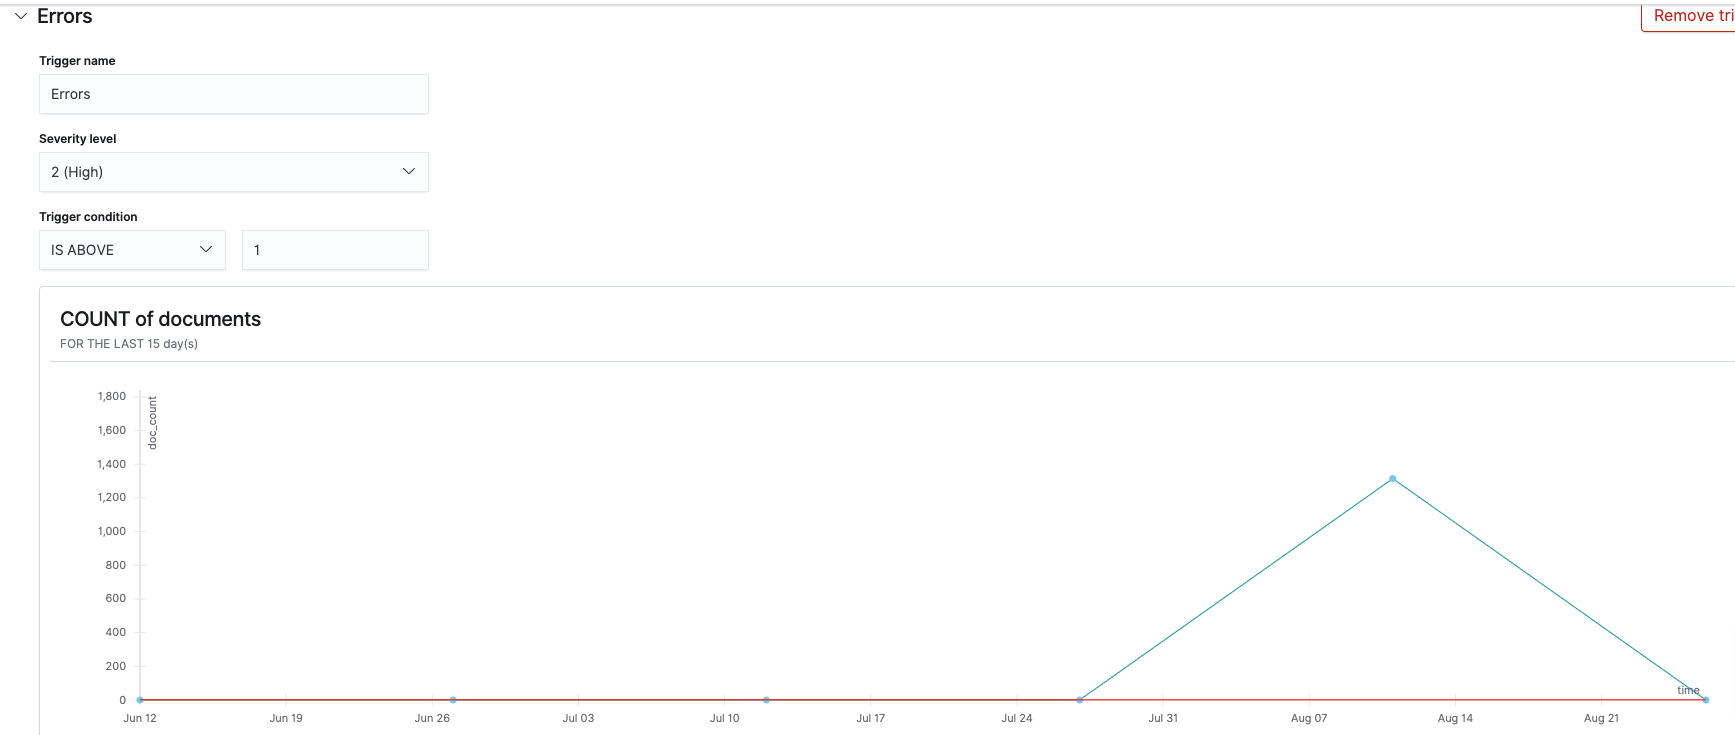
This is how our example monitor will appear; it shows when in the last 15 days our Connections app had errors in the log (Image 15).

- Once our monitor is created, we need to define a trigger condition. When this condition is met, the alert will be pushed out to our defined Recipient(s). In this example we want to be alerted when there is more than one stderr in our Connections stream (Image 16). Input the following:
- Trigger Name
- Severity Level
- Trigger Condition: In this example, we use IS ABOVE and the threshold of 1.
The trigger threshold will be visible on your monitoring graph as a red line.
Alerting on Kubernetes restarts
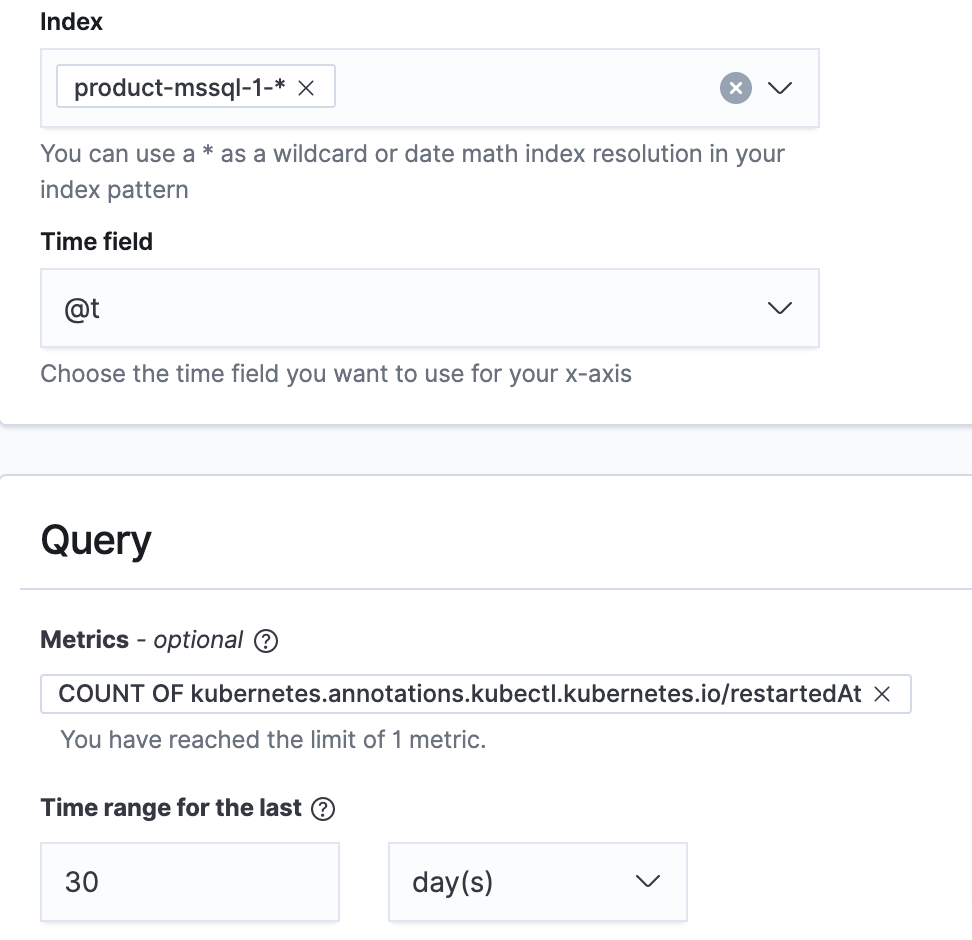
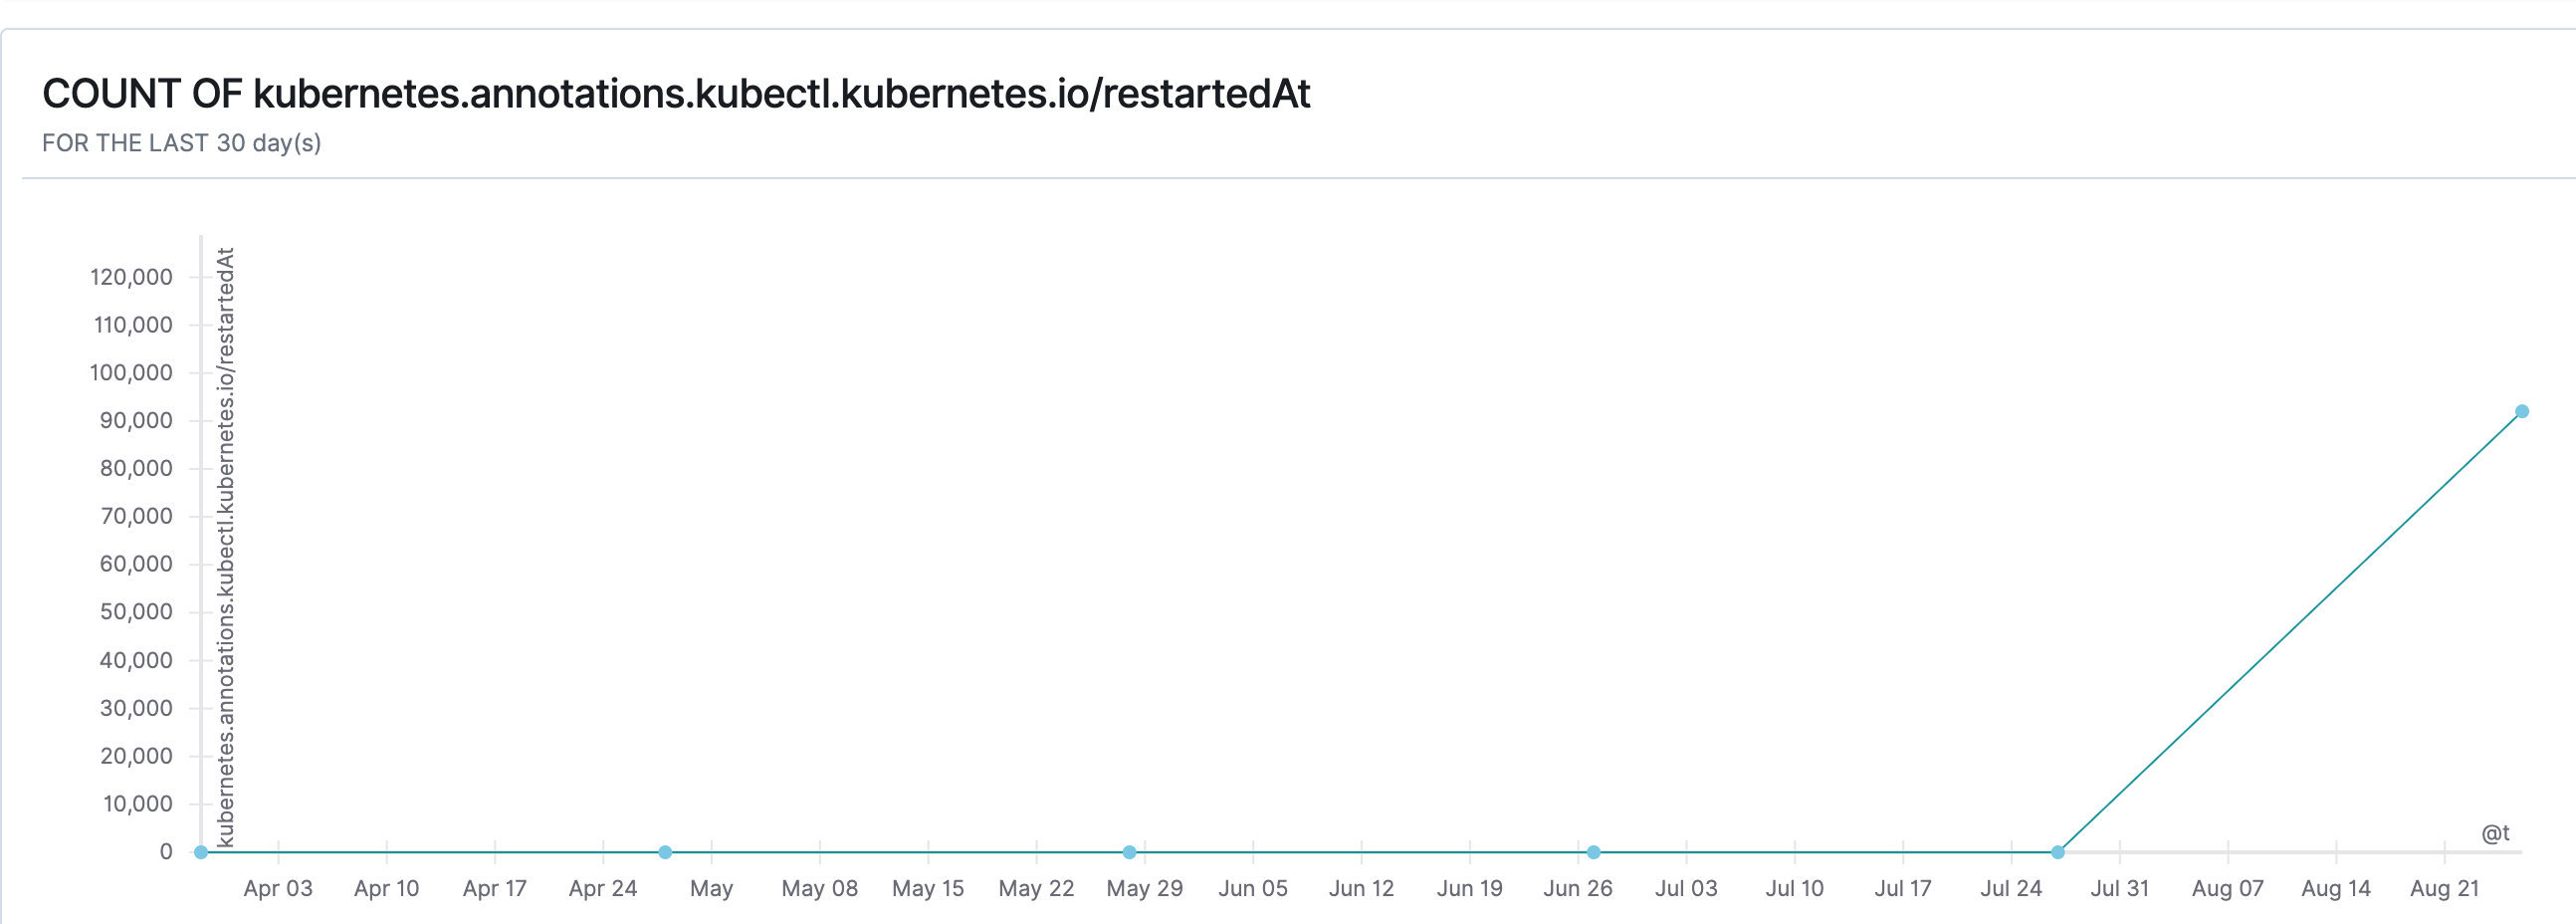
This example pushes an alert based on the kubectl.kubernetes.io/restartedAt annotation, which updates whenever your pod restarts. We will monitor this annotation across our entire product-mssql instance, and push out an alert when our trigger threshold is hit.
- First we create our Monitor by defining the following (Image 17):
- Index: This example looks at the entire product-mssql instance.
- Time Field
- Query: This example is using the total count of the kubectl.kubernetes.io/restartedAt annotation.
- Time Range: Define how far back you want to monitor. This example goes back 30 days.
This is how our example monitor will appear; it shows when in the last 30 days our instance had restarts (Image 18).
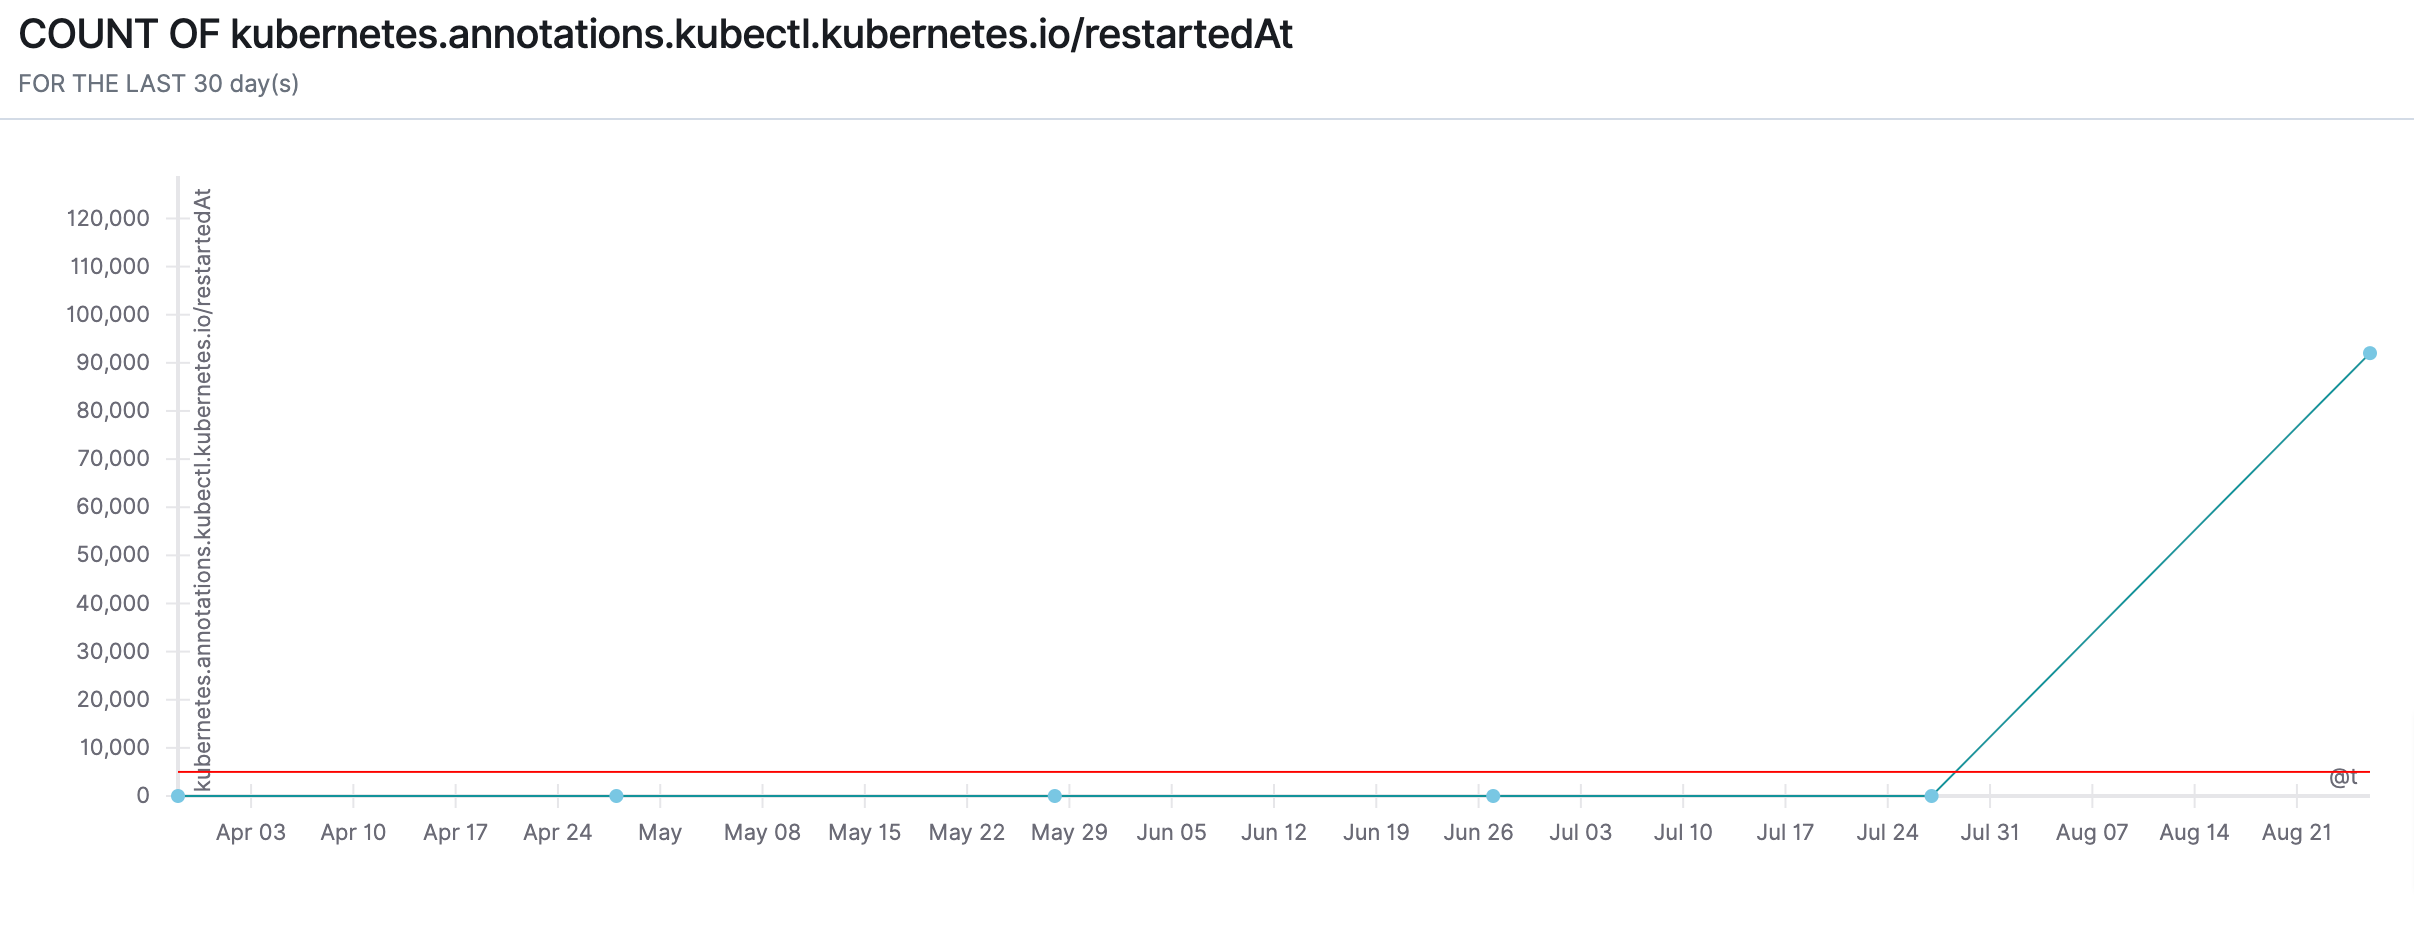
2. Once our monitor is created, we need to define a trigger condition. When this condition is met, the alert will be pushed out to our defined Recipient(s). In this example we want to be alerted when there is more than 100 restarts across our instance (Image 19). Input the following:
- Trigger Name
- Severity Level
- Trigger Condition: In this example, we use IS ABOVE and the threshold of 100.
The trigger threshold will be visible on your monitoring graph as a red line.
Alerting on status codes
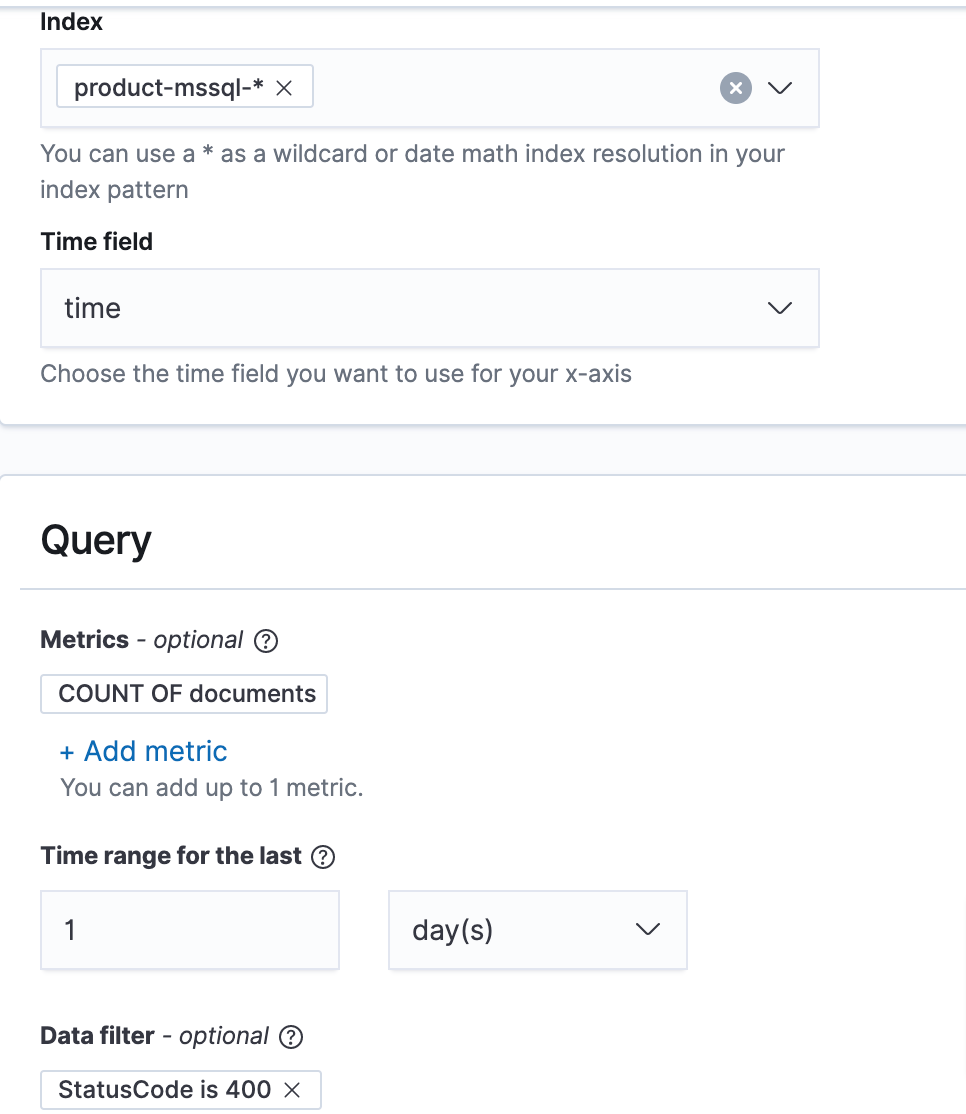
This example pushes an alert based on status codes. We will monitor our entire instance for 400 status codes and push out an alert when our trigger threshold is hit.
- First we create our Monitor by defining the following (Image 20):
- Index: This example looks across the entire product-mssql-1 instance.
- Time Field
- Time Range: Define how far back you want to monitor. The time range for this example is the past day.
- Data Filter: We want to monitor specifically whenever the Status Code is 400 (bad request).
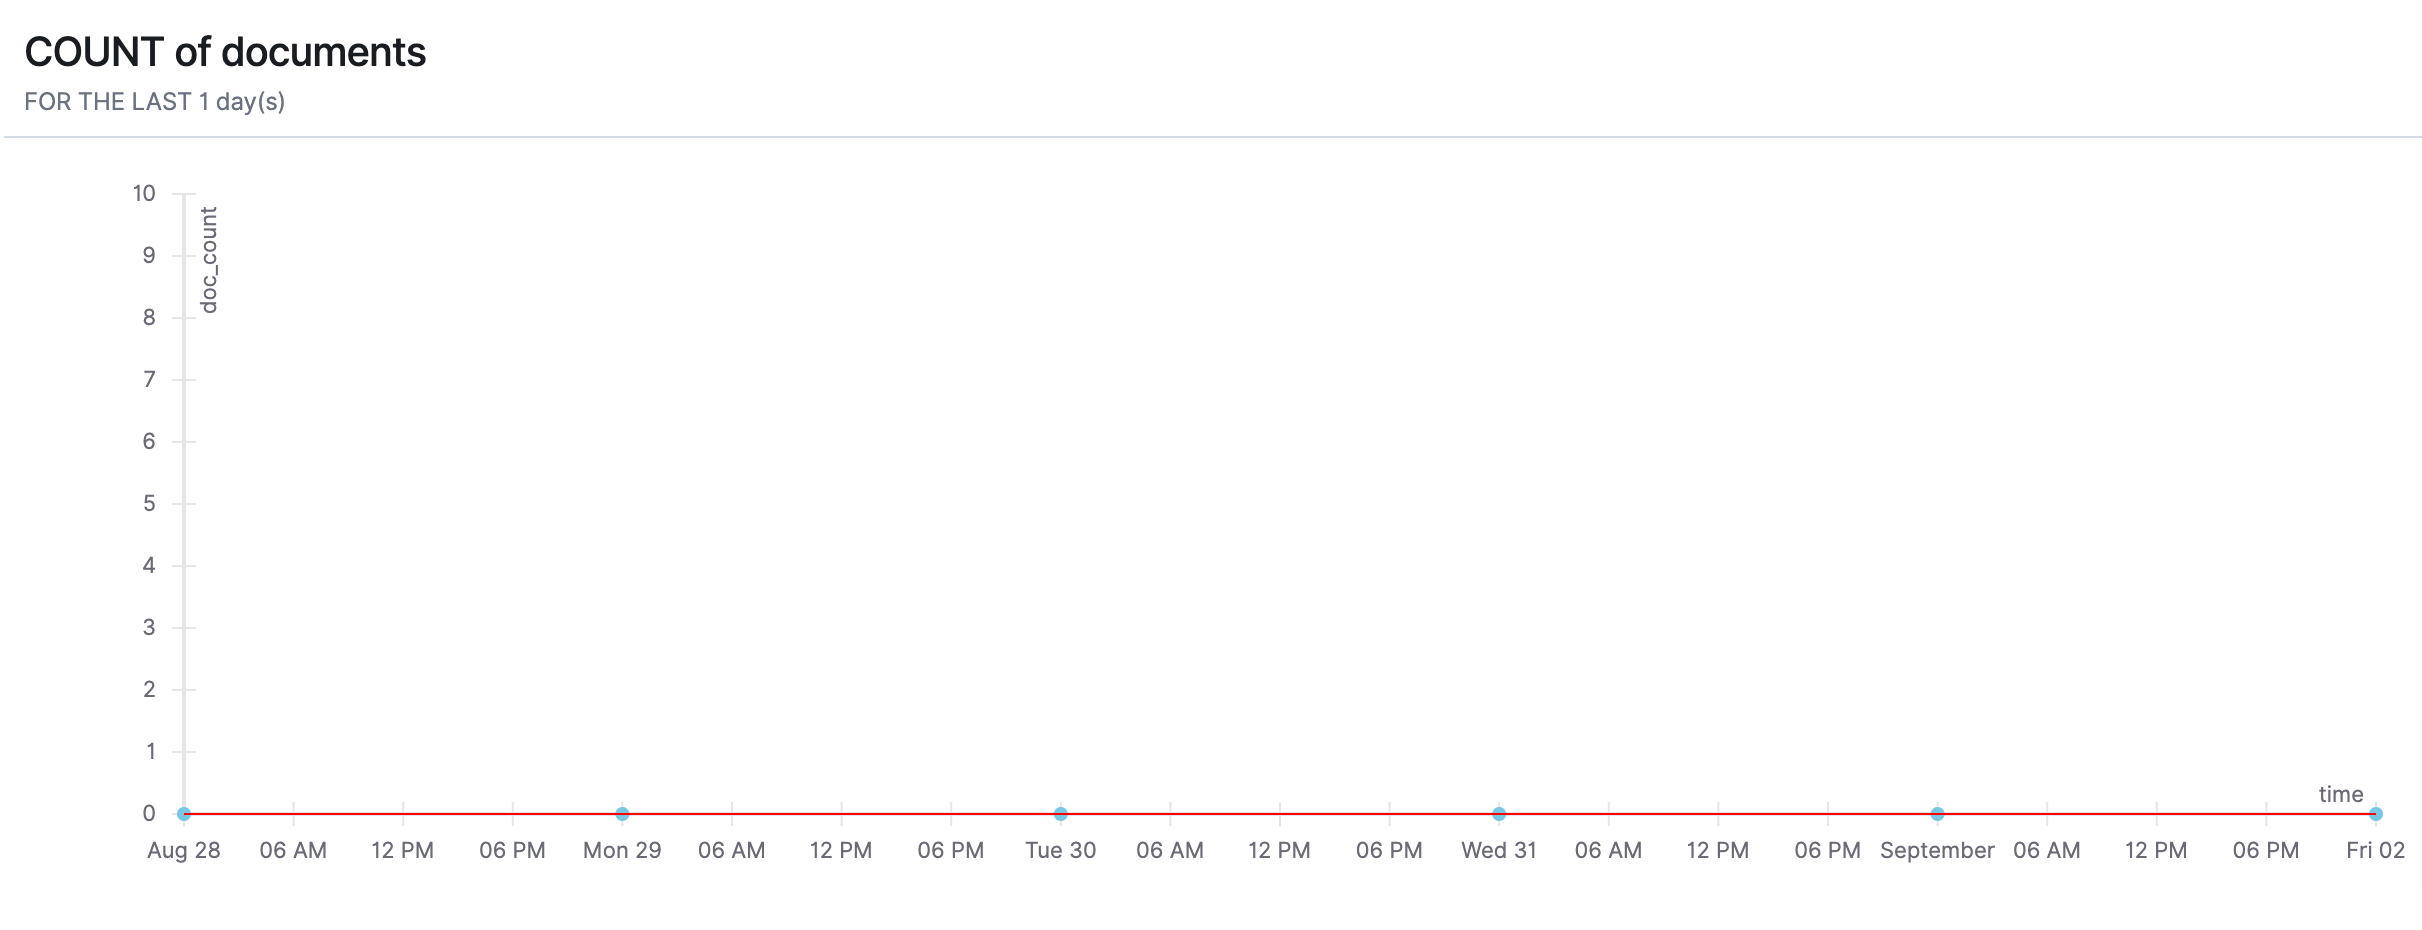
This is how our example monitor will appear (note that there are no instances of a 400 status code in this graph) (Image 21).
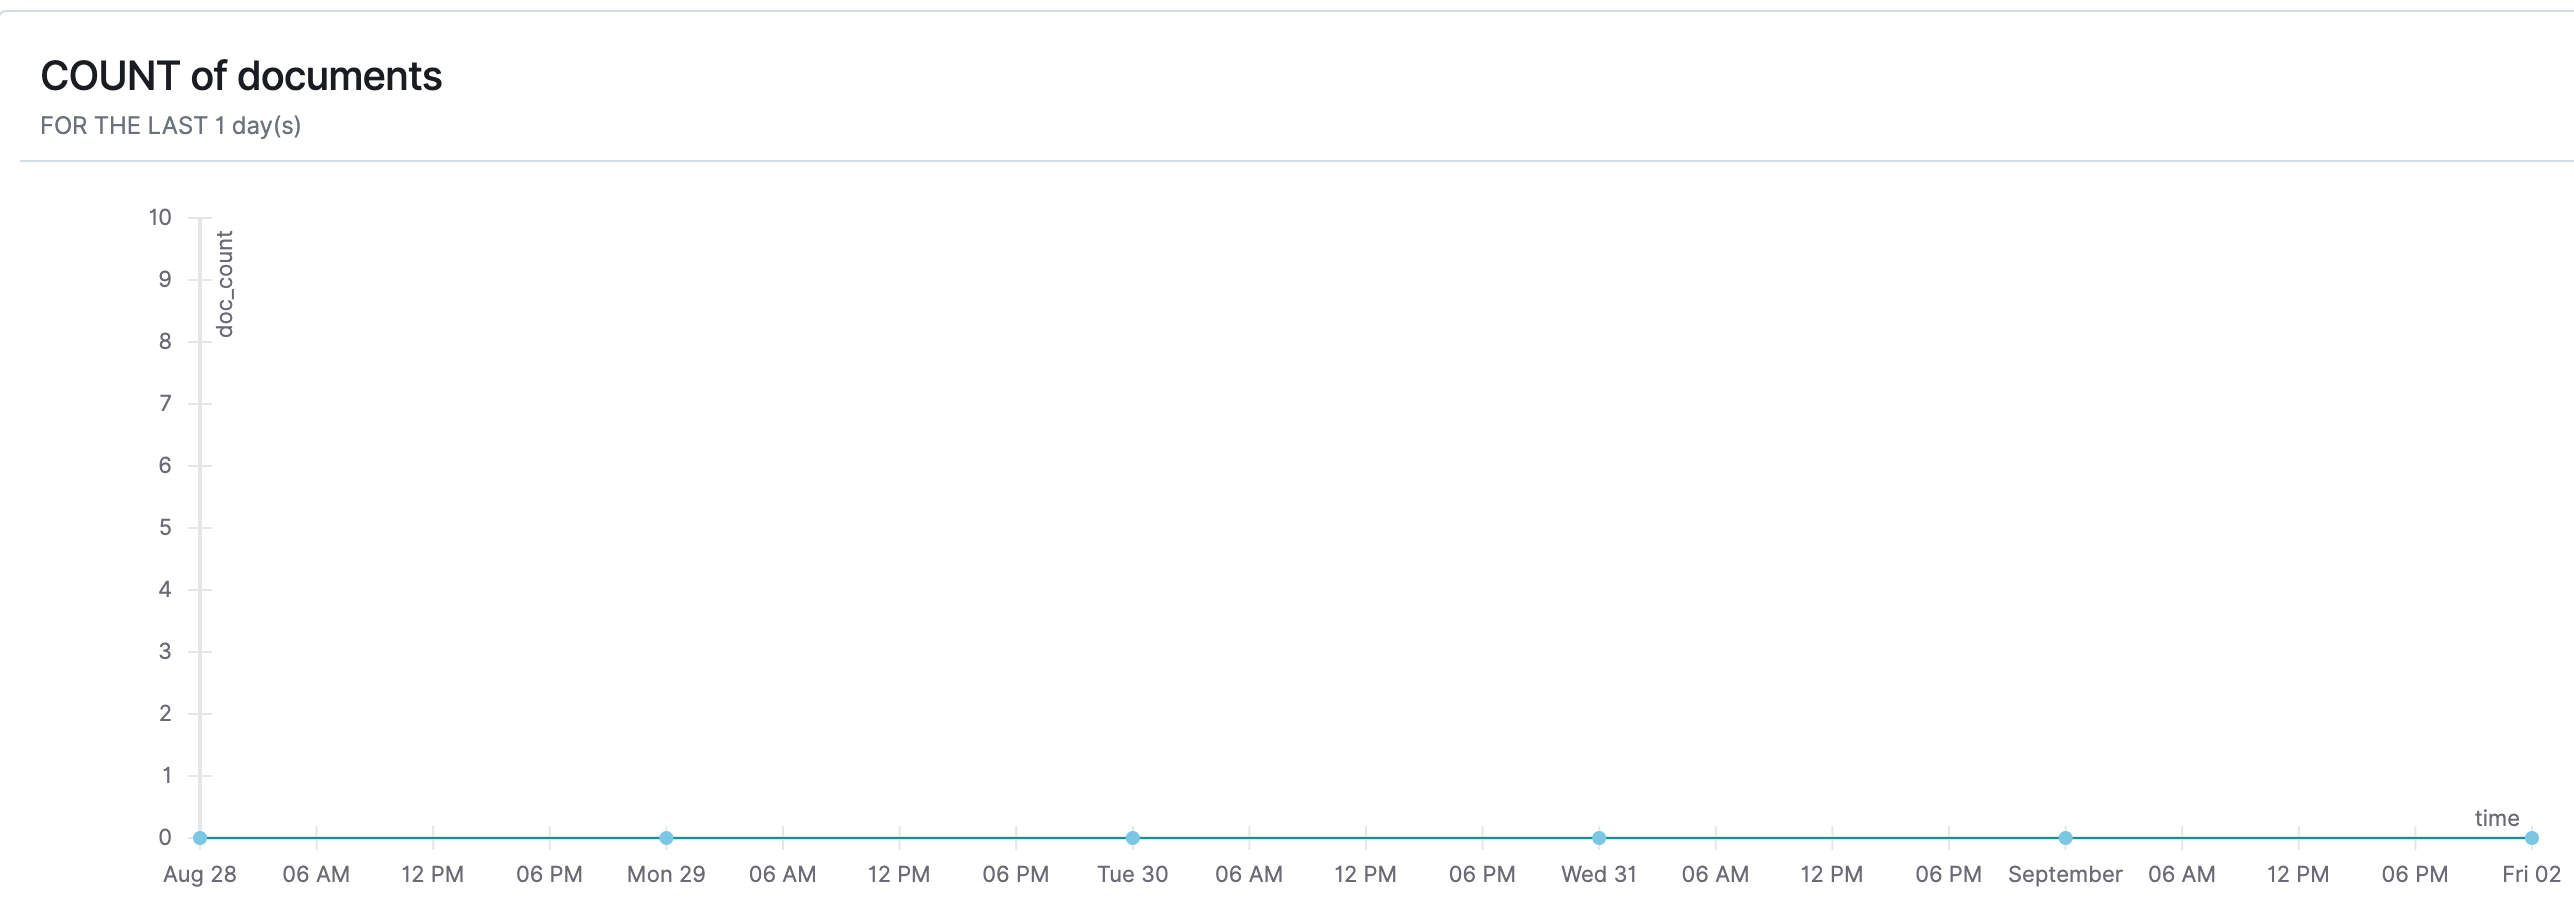
- Once our monitor is created, we need to define a trigger condition. When this condition is met, the alert will be pushed out to the defined Recipient(s). In this example we want to be alerted when there is at least one 400 status code across out instance (Image 22). Input the following:
- Trigger Name
- Severity Level
- Trigger Condition: In this example, we use IS ABOVE and the threshold of 0.
The trigger threshold will be visible on your monitoring graph as a red line.
